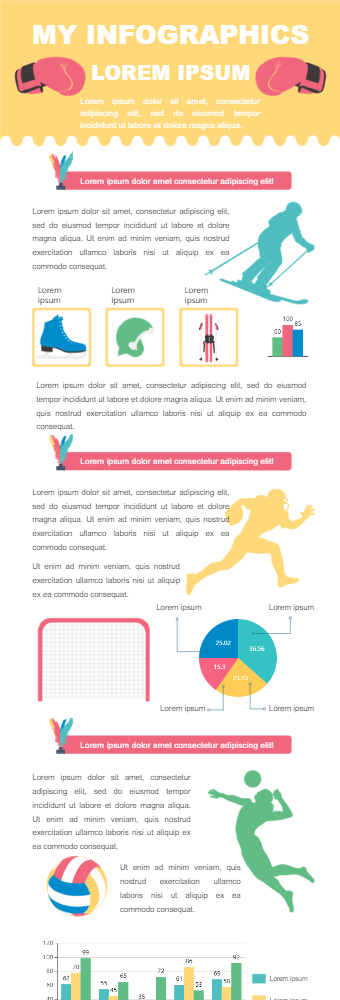
The first infographic used skiing gear items along with a bar chart. The bar chart can be used for visually presenting and comparing sales. The next infographic is of football or rugby with a pie chart. This pie chart can be used to present sales in different markets. This is a very good tool to show which market generates most of the sales. The last infographic shows volleyball and cluster bar charts. A cluster bar chart can be used to compared relevant sales among males, females, and kids in different countries. The infographics are of high quality and colorful. This makes it visually easy to comprehend data. Also, the selection of different charts helps understand the ideas from different perspectives. This can be used by businesses to present their sales data in a visually appealing way both in and outside of their company.