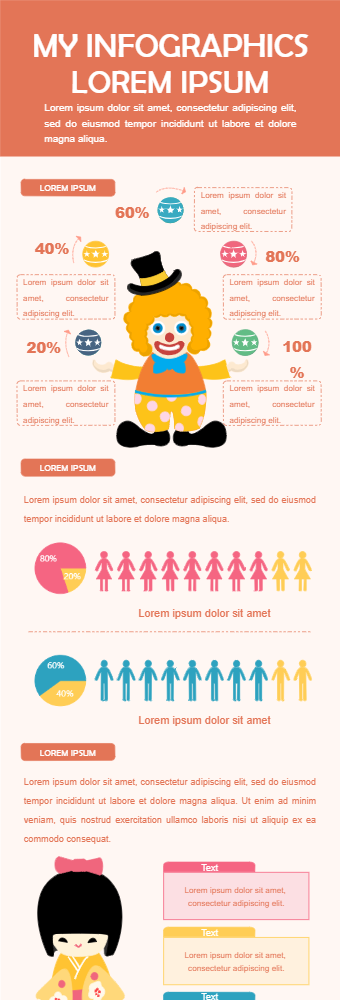
The first infographic has percentages that can be used to show percentages of people's attendance at different kinds of parties. Next, we have separate male and female graphs to show what percentage of males and females go to a party. We also have pie charts to show male and female percentages for attending a party. Next, we have an infographic for overall party statistics. It has a histogram that can be used to show the number of people that attend a party in the different months of the year. This is best to compare and identify the best time for parties and related businesses. The infographics used are perfect choice for the intended theme.These infographics can be used by restaurants, shops, and party holder businesses. They can use these to communicate to their audience such as employees or business partners about trends in this field.


 Desktop