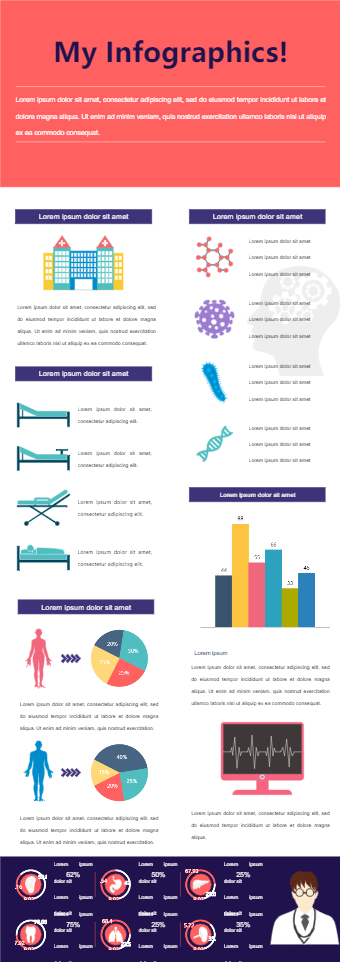
Health data visualization infographics can be used in many scenarios regarding health issues and facilities. It uses graphics along with statistics to show different health conditions and their repercussions. It has different parts that can be customized for different scenarios. It shows a hospital building and the other side shows different types of viruses and bacteria. You can define different microbes here along with the given images or use your own.
Another part of this infographic uses gender based statistics. For example, you can use this to predict the prevalence of different diseases in both genders with percentage. The last section shows different organs where you can either show best practice to keep them healthy. Alternatively, you may use it to show effects of disease on these organs.
This infographic can be used for disease profile, general health related information and hospital facilities pamphlets.