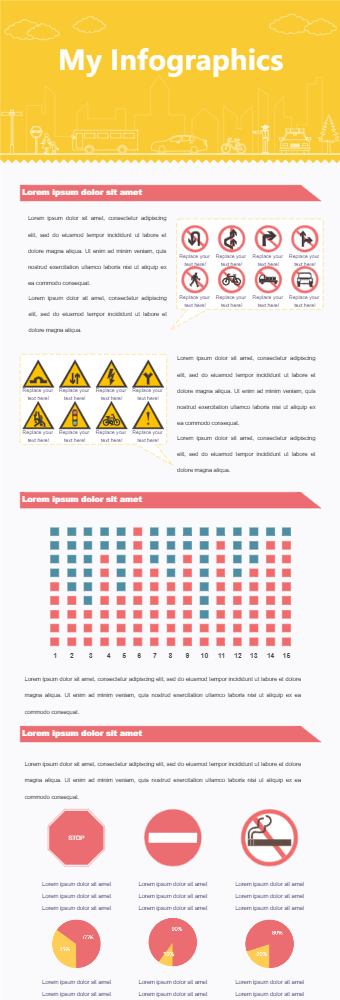
Traffic signals infographics guide traffic rules. They are in bright colors to capture the audience's attention. This violation infographic with a corresponding pie chart can be used to show percentages of accidents, death, diseases crimes, etc. caused by a certain violation. A great tool to present information visually. A waffle chart can be used to compare different violations' impacts. Infographics show people with different lifestyles combine with a bar chart that can be used to present the violator's background and lifestyle.
These infographics can be used for general public traffic rules awareness. Teachers can use it in classrooms to make students generally aware of the importance of the rules. Articles and blogs can use these infographics to pack loads of information in just a few infographics about traffic violations.