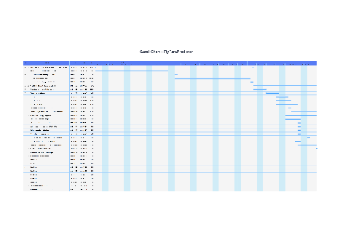
This is a Gantt chart for a flight fare prediction system. This template consists of a horizontal axis representing time, and a vertical axis representing the different tasks or activities in the project. Each task is represented by a bar, with the left end of the bar indicating the task's start date, and the right end indicating the task's end date. Dependencies between tasks are shown by connecting the bars with arrows or lines.
Gantt charts are widely used in project management to plan and schedule complex projects, and to track progress over time.


 Desktop