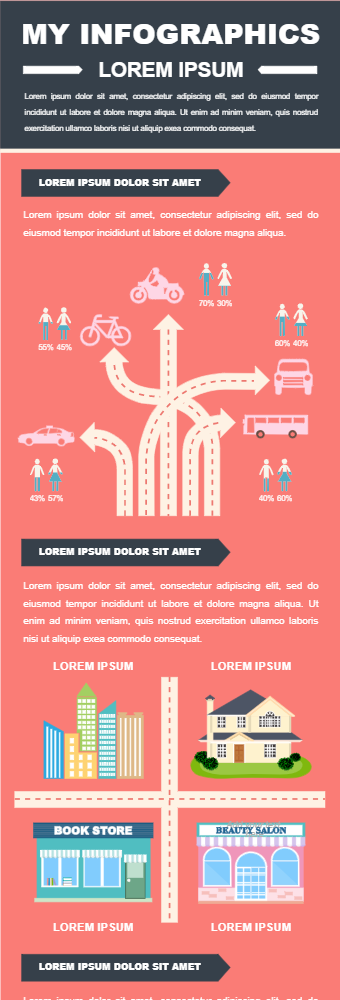
This commuting infographic template has many elements including both text and graphics. The first part shows a network of paths with different modes of transportation. For example, bicycles, motorbikes, cars, buses and cabs. You can show your data according to your parameters based on the difference of gender. The data is customizable and you can change the percentages of different elements. Next section is based on different types of buildings including a bookstore, beauty salon, high rise buildings and homes. The last section is purely based on statistical data. It has a waffle chart and a bar chart to show a whole range of data in a compact form.