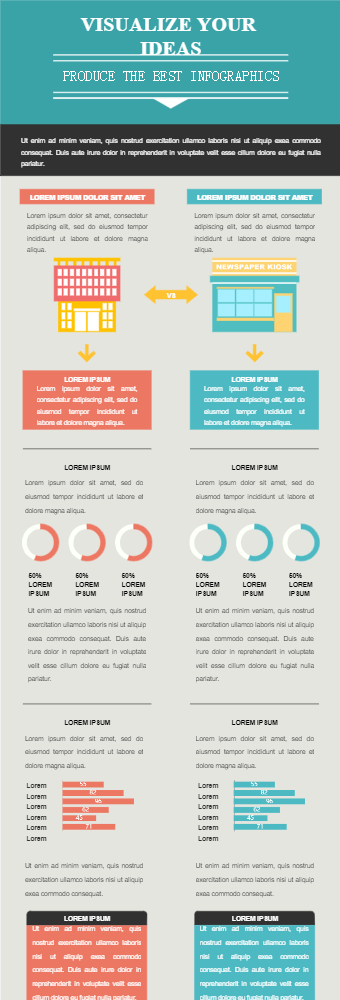
This is a business infographic. This can be used to compare two businesses in various aspects. The first section can be used to describe the nature of the businesses. The next section has two sections, each section has progressive circle charts that can be used to show each company percentage increase in, revenue, customers, profits, etc. This will help compare businesses in different facets to evaluate their overall efficiency and effectiveness in carrying out their operations. The next section can be used to compare the number of different products or services sold by each business and to draw a conclusion. It has a bar chart that can be used for plotting items sold. This infographic layout and charts are perfect for comparison. It packs a lot of data in a visually appealing way without looking stuffed with data. This infographic can be used by businesses to show a comparison of businesses in different aspects.