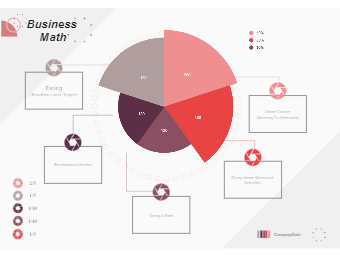
Pie charts, circular charts divided into segments that each indicate a value, are used in data handling. Pie charts are broken into pieces (or slices) to illustrate varying sizes of values. For example, this template shows the proportions of various activities done in a day, such as eating, recreation, online classes, etc. A pie chart is most useful when determining the composition of anything. View more pie chart templates on EdrawMax.


 Desktop