
Templates Community /
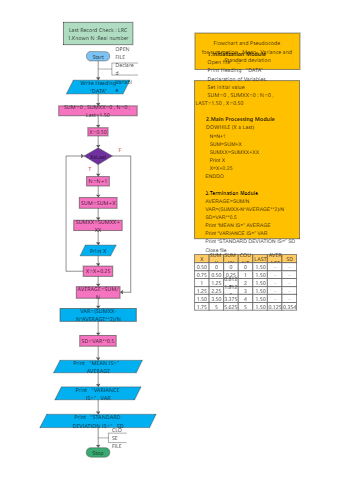
Algorithm Flowchart for summation , Mean , Variance and Standard deviation
Algorithm Flowchart for summation , Mean , Variance and Standard deviation

Published on 2021-10-18

 Desktop


Post
Recommended Templates
