
Templates Community /
Bar Graph Chart
Bar Graph Chart
Lisa Anderson
Published on 2021-10-19

 Desktop

1. Introduction
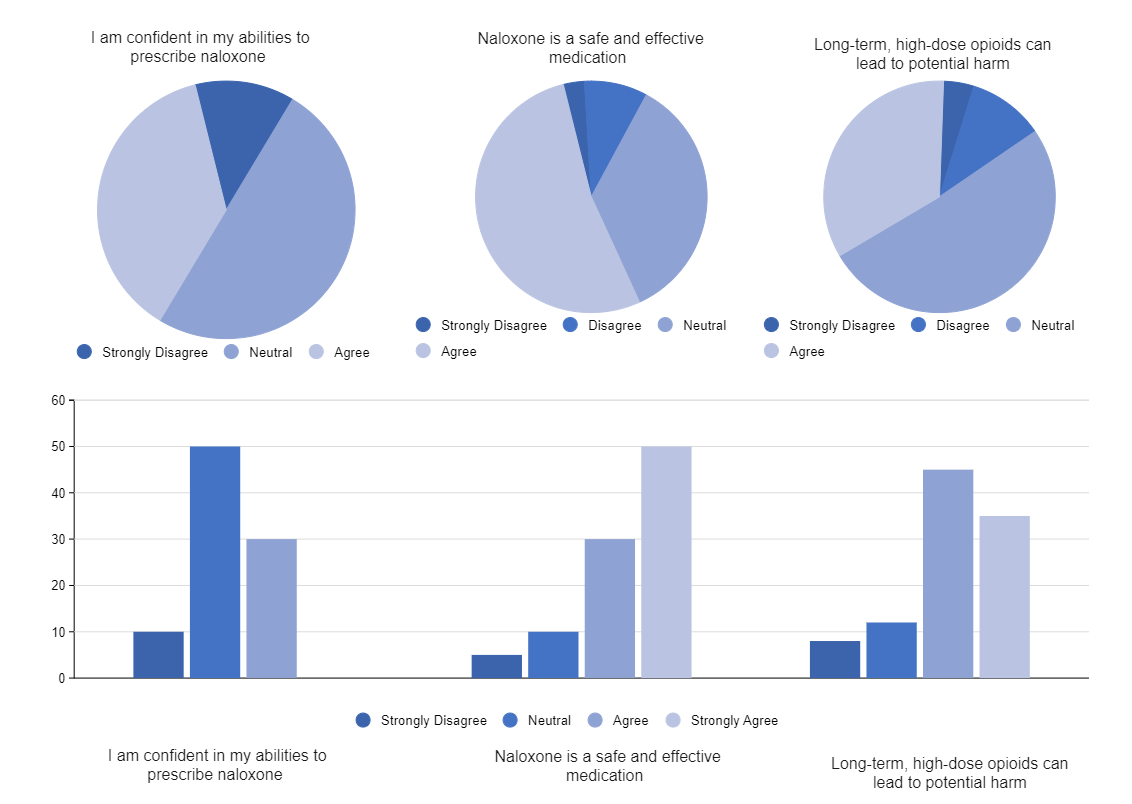
In addition, pie charts show how much each category represents as a proportion of the whole by using a circular format with different-sized "slices" for different percentages of the whole. Bar graphs use a series of rectangular bars to show absolute values or proportions for each category.
2. What is Bar Graph Chart
Bar graphs can be used to compare objects or to show how something changes over time. They have a horizontal x-axis and a vertical y-axis (vertical). The x-axis usually has numbers that represent the time period or what is being measured, while the y-axis contains numbers that represent the amount of material being measured.
3. How to Create a Bar Graph Chart
Creating a chart in EdrawMax is pretty simple. The free chart maker has several features, like directly importing the data from the .csv file or creating one from scratch using free templates.
Step 1: Login EdrawMax
Log in EdrawMax using your registered email address. If this is your first time accessing the tool, you can create your personalized account from your personal or professional email address.
Step 2: Choose a template
EdrawMax Online comes with hundreds of free chart templates. Select a pre-designed template from the product based on your preference or need by selecting the "Graph and Chart" on the left navigation pane. It will open up several chart types. Alternatively, press "+" in EdrawMax Online canvas to create a card from scratch.
Step 3: Customize the diagram
Customize your chart by changing the symbols and shapes as required. With the easy drag-and-drop feature of EdrawMax Online, you can use all the relative elements from libraries.
Step 4: Export & Share
Once your chart is completed, you can share it amongst your colleagues or clients using the easy export and share option. You can export a chart in multiple formats, like Graphics, JPEG, PDF, or HTML. Also, you can share the designs on different social media platforms, like Facebook, Twitter, LinkedIn, or Line.
Tag
bar chart
graph and chart
Graph Chart Collection
Share
Report
29
1.9k

Post
Recommended Templates
Loading
