
Templates Community /
Stock Bar Chart
Stock Bar Chart
Lisa Anderson
Published on 2021-10-19

 Desktop

1. Introduction
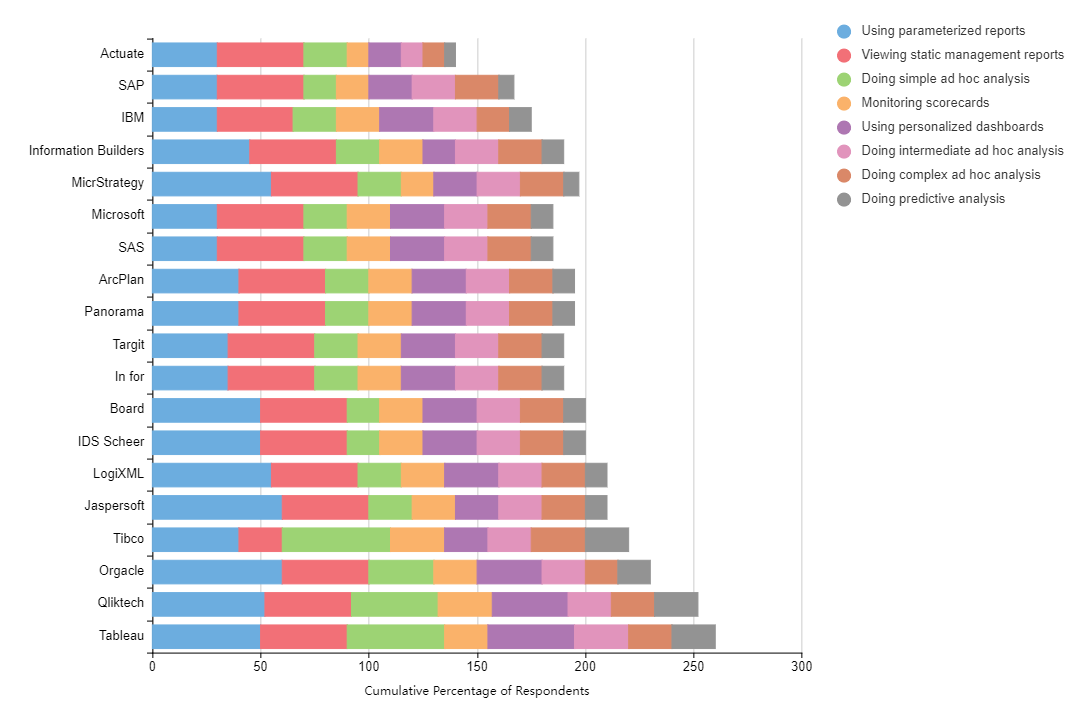
It is also called a 100% stacked bar graph because each horizon bar represents 100% of the discrete data value and all the bars are of the same length while numerical variations are indicated in percentages. Other types of horizontal bars chart include a reverse horizontal bar chart and a basic horizontal bar chart. You can use EdrawMax Online to create such segmented horizontal bar charts for your usage.
2. What is a Stock Bar Chart
A bar chart shows the open, high, low, and close prices of an asset or security over a given time period. The high and low prices for the period are represented by the vertical line on a price bar. The open and closing prices are represented by the left and right horizontal lines on each price bar.
3. How to Create a Stock Bar Chart
Creating a chart in EdrawMax is pretty simple. The free chart maker has several features, like directly importing the data from the .csv file or creating one from scratch using free templates.
Step 1: Login EdrawMax
Log in EdrawMax using your registered email address. If this is your first time accessing the tool, you can create your personalized account from your personal or professional email address.
Step 2: Choose a template
EdrawMax Online comes with hundreds of free chart templates. Select a pre-designed template from the product based on your preference or need by selecting the "Graph and Chart" on the left navigation pane. It will open up several chart types. Alternatively, press "+" in EdrawMax Online canvas to create a card from scratch.
Step 3: Customize the diagram
Customize your chart by changing the symbols and shapes as required. With the easy drag-and-drop feature of EdrawMax Online, you can use all the relative elements from libraries.
Step 4: Export & Share
Once your chart is completed, you can share it amongst your colleagues or clients using the easy export and share option. You can export a chart in multiple formats, like Graphics, JPEG, PDF, or HTML. Also, you can share the designs on different social media platforms, like Facebook, Twitter, LinkedIn, or Line.
Tag
bar chart
graph and chart
Graph Chart Collection
Share
Report
2
555

Post
Recommended Templates
Loading
