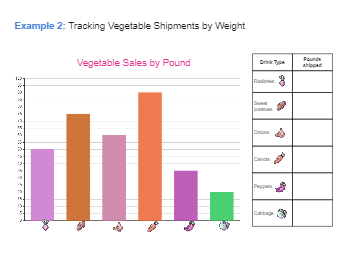
You can use EdrawMax Online to create a bar chart where you can mention the fruits or vegetables on the X-Axis, and on the Y-Axis, you can add the quantity that has to be shipped. You can create a graph chart to track the vegetable shipment by weight. As shown below, radishes are sold 50 pounds; sweet potatoes are sold over 70 pounds; onions are sold 60 pounds; carrots are sold 90 pounds; peppers are sold over 35 pounds, and cabbages are sold over 20 pounds. It should be noted here that bar graphs are ideal for comparing two or more values or values over time. Data is displayed either horizontally or vertically. Single bar graphs are used to convey discrete values of an item within a category.


 Desktop