
Template Community /
Clustered Bar Chart
Clustered Bar Chart
Lisa Anderson
Published on 2021-10-19

1. Introduction
It should be noted here that the sales chart is a visual representation of the sales data for a given period. Usually, the sales chart represents comparisons of sales data for a specific period, or particular customer, for one specific product or as a comparison with other products or periods.
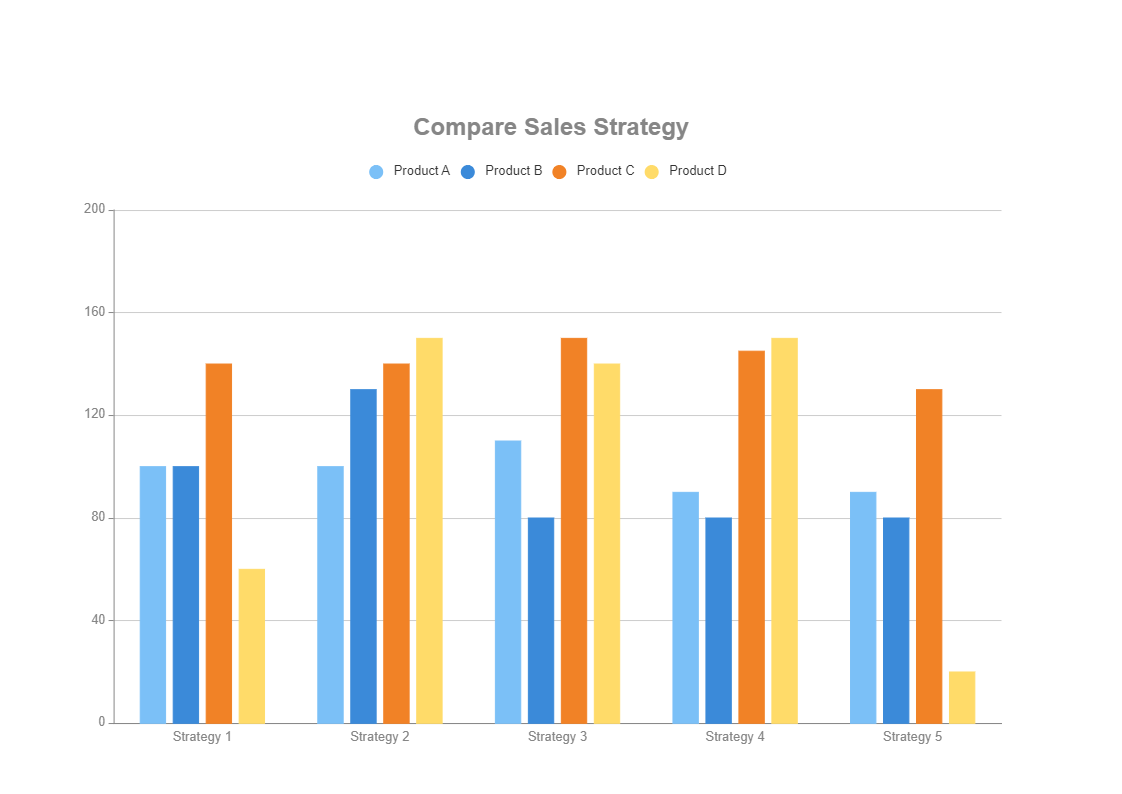
2. What is Clustered Bar Chart
Multiple data series are displayed in clustered horizontal columns in a clustered bar chart. Horizontal bars are grouped by category because each data series has the same axis labels. Clustered bars enable for direct comparison of many series within a category, however comparing the same data series across categories is more challenging for the human eye.
3. How to Create a Clustered Bar Chart
Creating a chart in EdrawMax is pretty simple. The free chart maker has several features, like directly importing the data from the .csv file or creating one from scratch using free templates.
Step 1: Login EdrawMax
Log in EdrawMax using your registered email address. If this is your first time accessing the tool, you can create your personalized account from your personal or professional email address.
Step 2: Choose a template
EdrawMax Online comes with hundreds of free chart templates. Select a pre-designed template from the product based on your preference or need by selecting the "Graph and Chart" on the left navigation pane. It will open up several chart types. Alternatively, press "+" in EdrawMax Online canvas to create a card from scratch.
Step 3: Customize the diagram
Customize your chart by changing the symbols and shapes as required. With the easy drag-and-drop feature of EdrawMax Online, you can use all the relative elements from libraries.
Step 4: Export & Share
Once your chart is completed, you can share it amongst your colleagues or clients using the easy export and share option. You can export a chart in multiple formats, like Graphics, JPEG, PDF, or HTML. Also, you can share the designs on different social media platforms, like Facebook, Twitter, LinkedIn, or Line.
Tag
graph and chart
bar chart
Graph Chart Collection
Share
Report
4
325

Post
Recommended Templates
Loading
