
Templates Community /
X Bar Chart
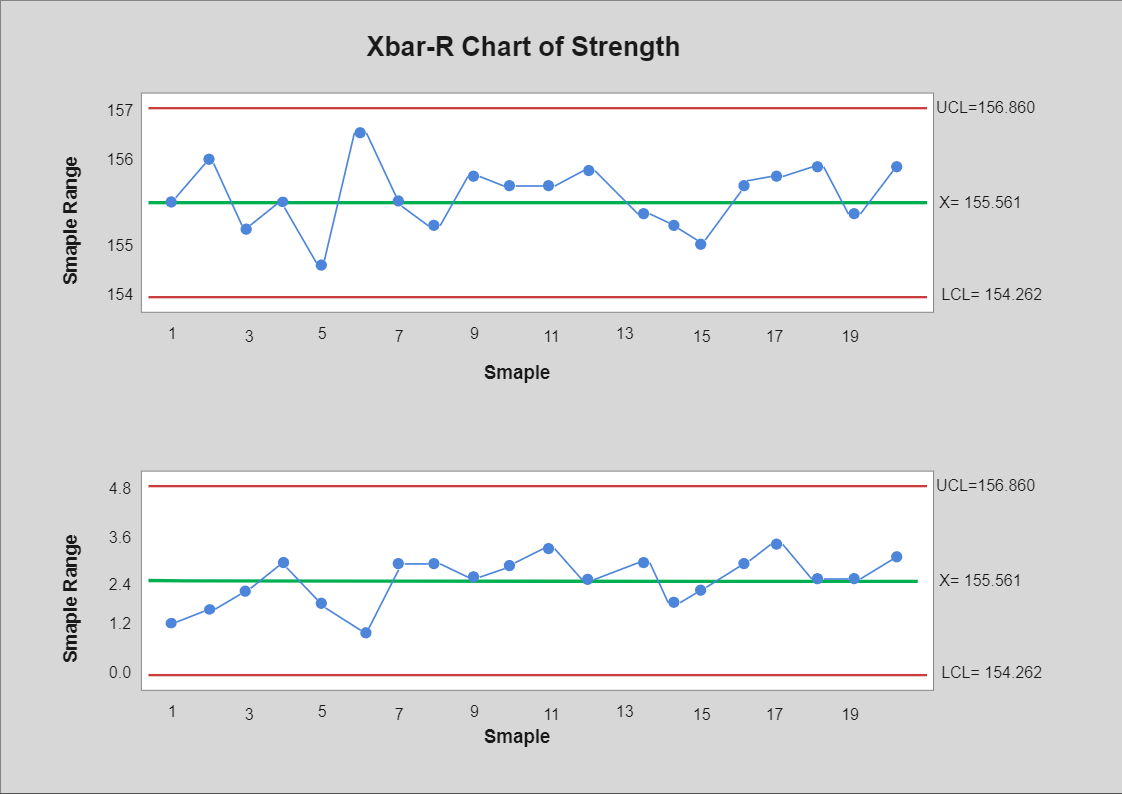
X Bar Chart
Lisa Anderson
Published on 2021-10-19

 Desktop

1. Introduction
As the above sample X-Bar Chart example suggests, the x-bar and R-chart are quality control charts used to monitor the mean and variation based on samples taken in a given time. The control limits on both chats are used to monitor the mean and variation of the process going forward. You can use EdrawMax Online to create X-Bar Charts for your project.
2. What is an X Bar Chart
The X-bar chart is a sort of Shewhart control chart used in industrial statistics to monitor the arithmetic means of successive samples of constant size, n. Weight, temperature, thickness, and other properties that may be measured on a continuous scale are utilized in this sort of control chart. For example, every hour, take a sample of 5 shafts from manufacturing, measure their diameters, and then plot the average of the five diameter values on the chart for each sample.
3. How to Create an X Bar Chart
Creating a chart in EdrawMax is pretty simple. The free chart maker has several features, like directly importing the data from the .csv file or creating one from scratch using free templates.
Step 1: Login EdrawMax
Log in EdrawMax using your registered email address. If this is your first time accessing the tool, you can create your personalized account from your personal or professional email address.
Step 2: Choose a template
EdrawMax Online comes with hundreds of free chart templates. Select a pre-designed template from the product based on your preference or need by selecting the "Graph and Chart" on the left navigation pane. It will open up several chart types. Alternatively, press "+" in EdrawMax Online canvas to create a card from scratch.
Step 3: Customize the diagram
Customize your chart by changing the symbols and shapes as required. With the easy drag-and-drop feature of EdrawMax Online, you can use all the relative elements from libraries.
Step 4: Export & Share
Once your chart is completed, you can share it amongst your colleagues or clients using the easy export and share option. You can export a chart in multiple formats, like Graphics, JPEG, PDF, or HTML. Also, you can share the designs on different social media platforms, like Facebook, Twitter, LinkedIn, or Line.
Tag
bar chart
graph and chart
Graph and Chart Collection
Share
Report
1
322

Post
Recommended Templates
Loading
