
Templates Community /
Grouped Bar Chart
Grouped Bar Chart
Lisa Anderson
Published on 2021-10-19

 Desktop

1. Introduction
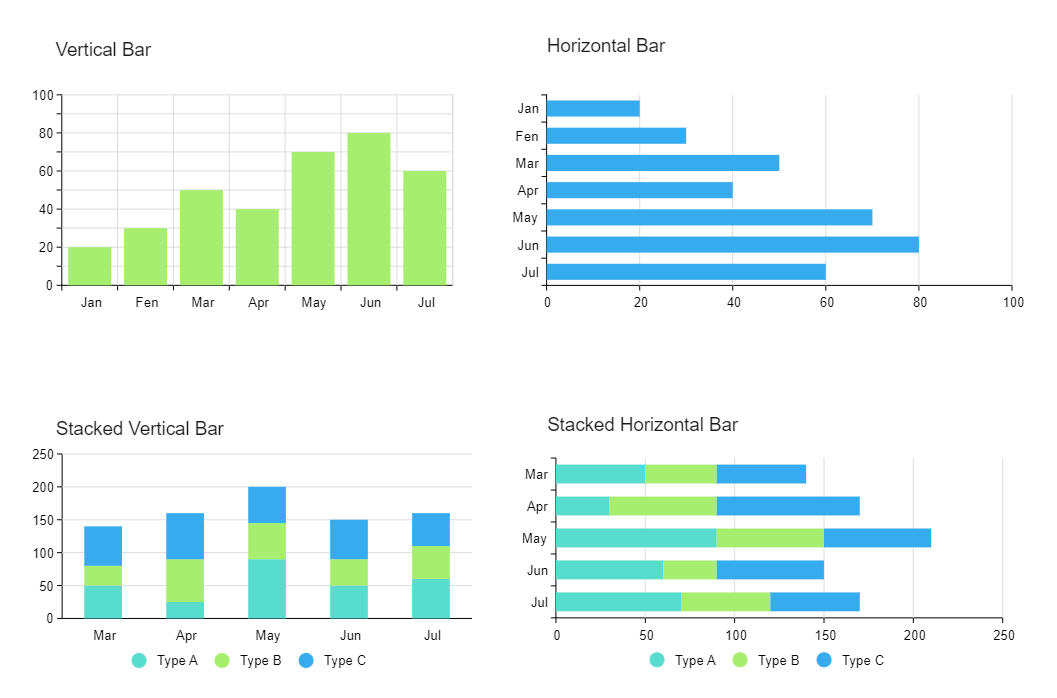
In a vertical Stacked Bar chart, categories are represented as bars, as in a basic vertical Bar Chart, but the bars are composed of series that are "stacked" on top of each other, with each series representing its value. Lastly, in a stacked horizontal bar, each horizontal bar in the graph represents a data category divided into subcategories using different colors within the same bar.
2. What is Grouped Bar Chart
Multiple sets of data items are compared in grouped bar charts, with a single color used to identify a specific series across all sets. Both vertical and horizontal versions of grouped bar charts are available, just like simple bar charts.
3. How to Create a Grouped Bar Chart
Creating a chart in EdrawMax is pretty simple. The free chart maker has several features, like directly importing the data from the .csv file or creating one from scratch using free templates.
Step 1: Login EdrawMax
Log in EdrawMax using your registered email address. If this is your first time accessing the tool, you can create your personalized account from your personal or professional email address.
Step 2: Choose a template
EdrawMax Online comes with hundreds of free chart templates. Select a pre-designed template from the product based on your preference or need by selecting the "Graph and Chart" on the left navigation pane. It will open up several chart types. Alternatively, press "+" in EdrawMax Online canvas to create a card from scratch.
Step 3: Customize the diagram
Customize your chart by changing the symbols and shapes as required. With the easy drag-and-drop feature of EdrawMax Online, you can use all the relative elements from libraries.
Step 4: Export & Share
Once your chart is completed, you can share it amongst your colleagues or clients using the easy export and share option. You can export a chart in multiple formats, like Graphics, JPEG, PDF, or HTML. Also, you can share the designs on different social media platforms, like Facebook, Twitter, LinkedIn, or Line.
Tag
bar chart
graph and chart
Graph Chart Collection
Share
Report
7
560

Post
Recommended Templates
Loading
