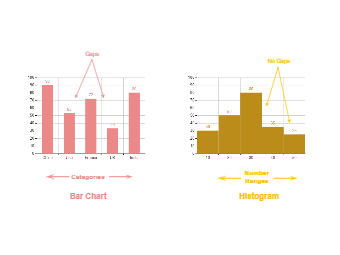
The below charts comparison diagram showcases a comparison between Bar Charts and Histograms. As the simple chart diagram suggests, there is a gap between different bars in the Bar Charts, but there are no gaps between bar charts in Histograms. In addition to this, the X-Axis in the Bar Chart shows Categories, but in Histogram, the X-Axis shows the Number Range. As the below diagram represents, a histogram represents the frequency distribution of continuous variables. Conversely, a bar graph is a diagrammatic comparison of discrete variables. The Histogram presents numerical data, whereas the bar graph shows categorical data. The Histogram is drawn in such a way that there is no gap between the bars.


 Desktop