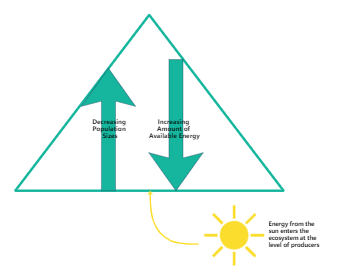
Here in this diagram we have a graphic organizer focusing on the concept of flow of energy. There is a triangle in the diagram with two arrows, one going up and the other going down. The arrow going up explains how the population size decreases as we go up the pyramid from bottom to top. At each level the population size is lower than the level below. The arrow going down shows the increasing amount of available energy. The pictorial representation of the Sun explains its role in the for pyramid-energy transfer process. The Sun’s energy enters the ecosystem at the level of the producers. Such color coded and pictorial representation of food pyramid-energy transfer proves to be effective for the students to learn the concept.


 Desktop