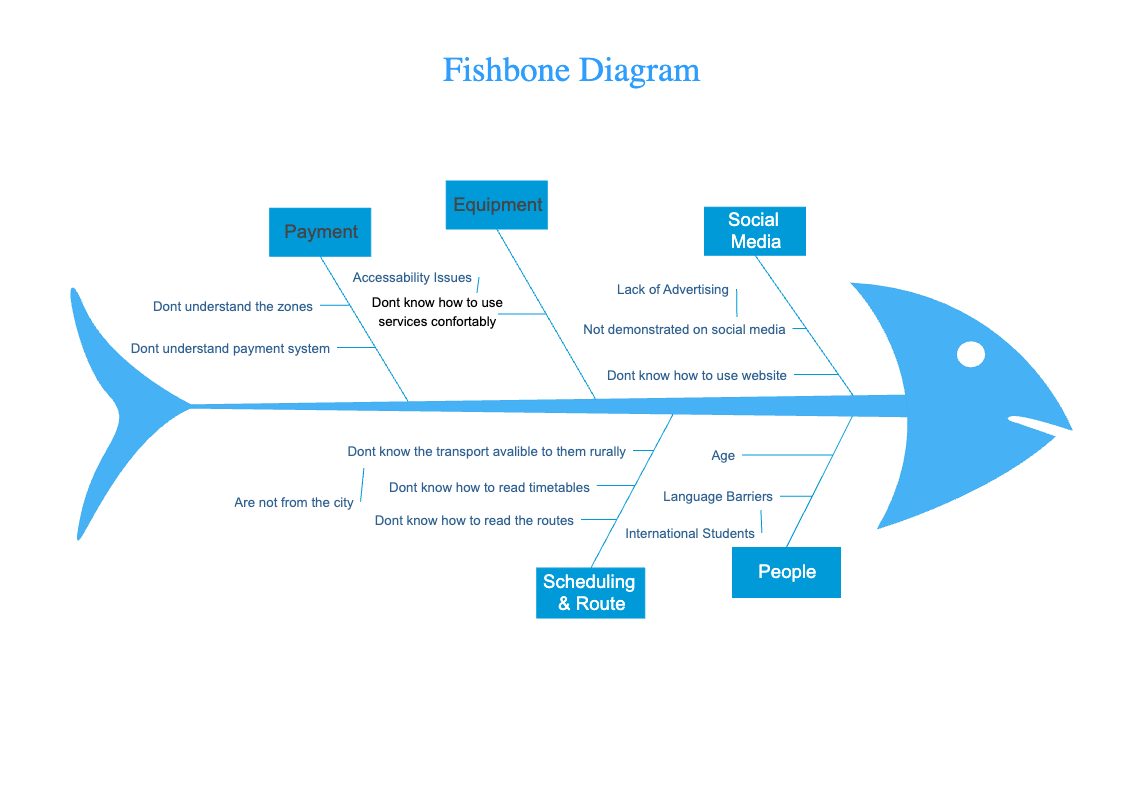
A Fishbone Diagram is a useful tool for understanding the causes and effects of a particular issue. In the case of using public transport, the main topic would be the benefits and drawbacks of this mode of transportation, with sub-topics such as affordability, convenience, accessibility, environmental impact, and safety. For example, under affordability, causes of high or low fares could include fuel prices, maintenance costs, or government subsidies. The effects of affordability could include the number of people who can afford public transport and the economic impact. Similarly, under the environmental impact, causes could include using renewable energy sources, while effects could include the reduction of carbon emissions and air pollution. Use EdrawMax to create a similar diagram for your projects. EdrawMax offers a wide range of similar templates that helps beginners and professionals in creating great-looking diagrams.


 Desktop