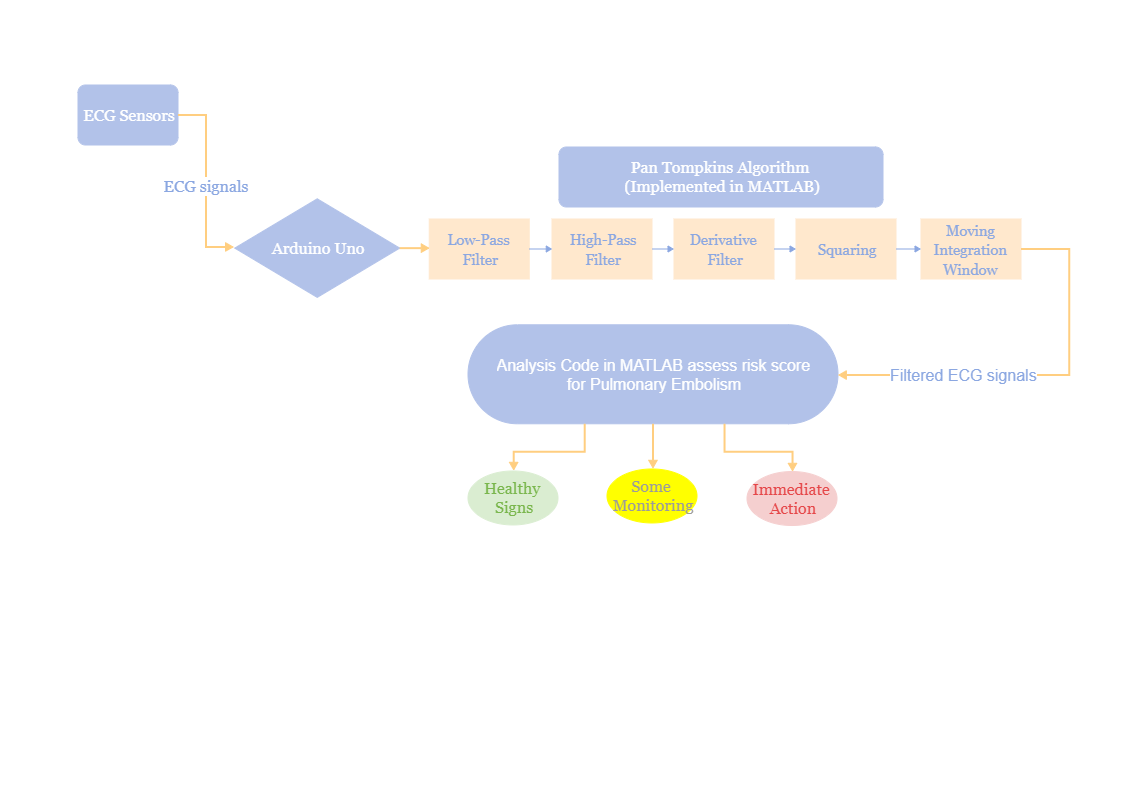
A signal processing flow chart is a graphic representation to depict any activity in a flow chart manner. These are mainly used for analysis purposes. They can be utilized for synthesis purposes too. Basically, a signal processing flow chart is used for getting a better understanding of a system and to find another alternative. A signal processing flow chart utilizes symbols like arrows to show the sequence of events. Other symbols like a square, a diamond, or a circle are used to enter details. A signal processing flow chart provides a clear understanding of a system and any other alternative design as well.


 Desktop