
Templates Community /
CDC Infographic
CDC Infographic
Joy
Published on 2021-11-19

 Desktop

1. Introduction
An Infographic is a chart, diagram, or any general illustration that uses graphic elements like images, icons, symbols, texts, and more to present information in a visually striking way. As you will learn in this CDC infographics today, infographics can include histograms, tree diagrams, mind maps, Gantt charts, network diagrams, pie charts, bar graphs, and more.
Before we go into detail and understand the importance of CDC Infographics, let us see the different types of infographics that are currently in trend in the business world:
1) Statistical Infographics
2) Informational Infographics
3) Process Infographics
4) Timeline Infographics; and
5) Anatomical Infographics
2. What is CDC Infographic
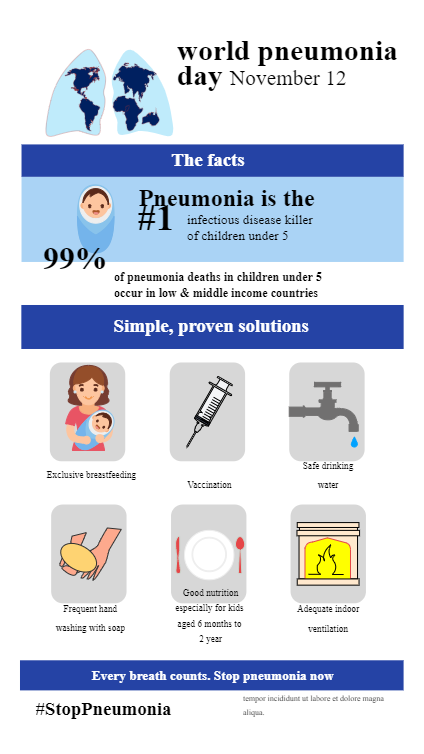
Every year, CDC releases multiple infographics to discuss and spread awareness about chronic illnesses. As you will see here, infographics are innovative ways of communicating any important information related to health and diseases. The following CDC infographics help understand important facts about pneumonia.
3. How to Create an Infographic
Creating an infographic in EdrawMax Online is pretty simple. The free form maker has several features as you can instantly import the images or icons from your system or Google Drive or DropBox. The infographic maker lets you import the data right from the .csv file, or you can also import media content, like images, icons, or symbols, right from your Google Drive or DropBox.
Step 1: Login EdrawMax Online
Log in EdrawMax Online using your registered email address. If this is your first time accessing the tool, you can create your personalized account from your personal or professional email address.
Step 2: Choose a template
EdrawMax Online comes with hundreds of free infographic templates. Select a pre-designed template by entering the Keyword in the ""Search"" section or exploring different diagram sets. In this case, you will find the form under the ""Design"" section diagram types. Alternatively, you can simply click on ""+"" in EdrawMax Online canvas to create a diagram of your preference.
Step 3: Customize the diagram
Customize your infographic by adding the relevant data based on the research or your information from your business team (sales, marketing, operations, and management).
Step 4: Export & Share
Once your required infographic is completed, you can share it amongst your colleagues or clients using the easy export and share option. You can further export the diagram in multiple formats, like Graphics, JPEG, PDF, or HTML. Also, you can share the designs on different social media platforms, like Facebook, Twitter, LinkedIn, or Line.
An Infographic is a chart, diagram, or any general illustration that uses graphic elements like images, icons, symbols, texts, and more to present information in a visually striking way. As you will learn in this CDC infographics today, infographics can include histograms, tree diagrams, mind maps, Gantt charts, network diagrams, pie charts, bar graphs, and more.
Before we go into detail and understand the importance of CDC Infographics, let us see the different types of infographics that are currently in trend in the business world:
1) Statistical Infographics
2) Informational Infographics
3) Process Infographics
4) Timeline Infographics; and
5) Anatomical Infographics
2. What is CDC Infographic
Every year, CDC releases multiple infographics to discuss and spread awareness about chronic illnesses. As you will see here, infographics are innovative ways of communicating any important information related to health and diseases. The following CDC infographics help understand important facts about pneumonia.
3. How to Create an Infographic
Creating an infographic in EdrawMax Online is pretty simple. The free form maker has several features as you can instantly import the images or icons from your system or Google Drive or DropBox. The infographic maker lets you import the data right from the .csv file, or you can also import media content, like images, icons, or symbols, right from your Google Drive or DropBox.
Step 1: Login EdrawMax Online
Log in EdrawMax Online using your registered email address. If this is your first time accessing the tool, you can create your personalized account from your personal or professional email address.
Step 2: Choose a template
EdrawMax Online comes with hundreds of free infographic templates. Select a pre-designed template by entering the Keyword in the ""Search"" section or exploring different diagram sets. In this case, you will find the form under the ""Design"" section diagram types. Alternatively, you can simply click on ""+"" in EdrawMax Online canvas to create a diagram of your preference.
Step 3: Customize the diagram
Customize your infographic by adding the relevant data based on the research or your information from your business team (sales, marketing, operations, and management).
Step 4: Export & Share
Once your required infographic is completed, you can share it amongst your colleagues or clients using the easy export and share option. You can further export the diagram in multiple formats, like Graphics, JPEG, PDF, or HTML. Also, you can share the designs on different social media platforms, like Facebook, Twitter, LinkedIn, or Line.
Tag
Enviornment Infographic
infographic
Infographic Collection
Share
Report
3
580

Post
Recommended Templates
Loading
