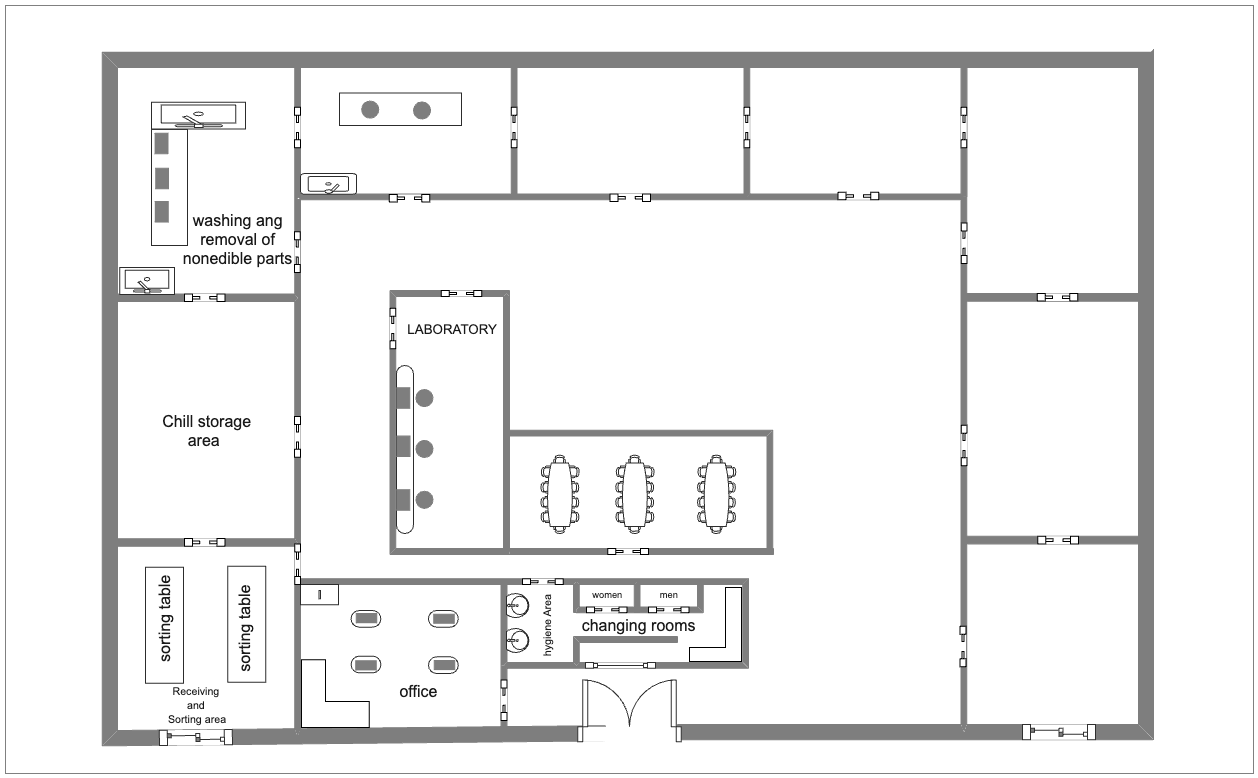
A laboratory plant diagram is a type of process flow diagram that illustrates the various steps involved in a specific laboratory process or activity. In the context of a food processing laboratory, a laboratory plant diagram might illustrate the steps involved in washing and preparing fresh produce for further analysis or experimentation. The diagram might include nodes that represent different stages of the process, such as washing, peeling, and removal of non-edible parts, as well as branches that represent the flow of materials or products between these stages. For example, the diagram might illustrate how fresh produce is first washed and sorted to remove any dirt or debris, then peeled or trimmed to remove any non-edible parts. The diagram might also include a separate branch that represents the chill storage area, where the prepared produce is stored at a controlled temperature to maintain freshness and prevent spoilage. By creating a laboratory plant diagram to illustrate the washing and removal of non-edible parts in a food processing laboratory, researchers can better understand the steps involved in preparing fresh produce for further analysis or experimentation and identify areas where improvements or optimizations can be made to the process. Use EdrawMax to create a similar diagram for your projects. EdrawMax offers a wide range of similar templates that helps beginners and professionals in creating great-looking diagrams.


 Desktop