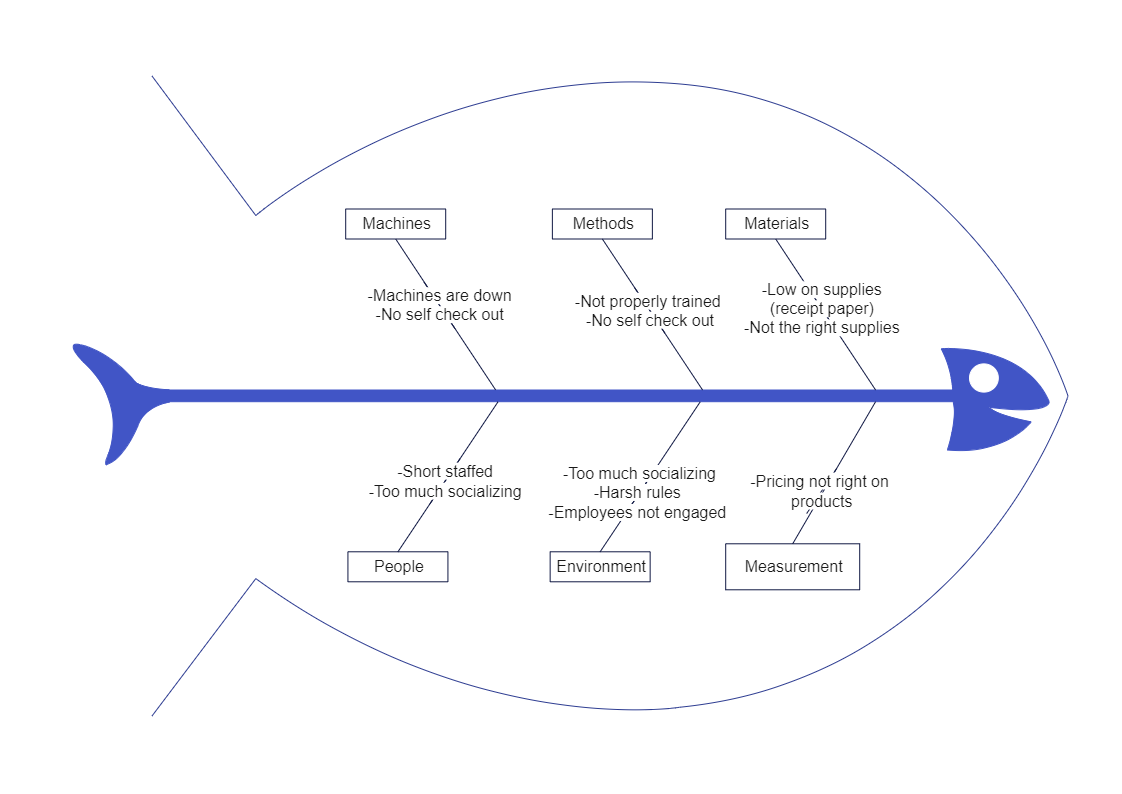
In the Business Cause and Effect Diagram, we see that Machines, Methods, Materials, Measurement, Environment, and People cause several effects that change the efficiency of any business model. As shown in the diagram below, cause and effect are the relationships between two things when one thing makes something else happen. In terms of business, if there is a delay in operation, it will result in subsequent loss. Another business cause and effect example would be if all the employees are satisfied and comfortable at their own pace, productivity and overall efficiency will increase. The Cause and Effect Diagram is also known as Fishbone Diagram, which can easily be created using EdrawMax Online.


 Desktop