
Templates Community /
Apple Ansoff Matrix
Apple Ansoff Matrix
Joy
Published on 2021-11-23

 Desktop

1. Introduction
The Ansoff Matrix is a tool used by companies to analyze and plan their strategy for growth. It is also known as the Product Expansion Grid. The Ansoff Matrix was developed by applied mathematician and business manager H. Igor Ansoff. It was published in the Harvard Business Review in 1957. It offers the company an uncomplicated and efficient way of analyzing options and risks involved when taking new strategic decisions. The Apple Ansoff Matrix will be discussed in this article extensively.
2. Understand Apple Ansoff Matrix
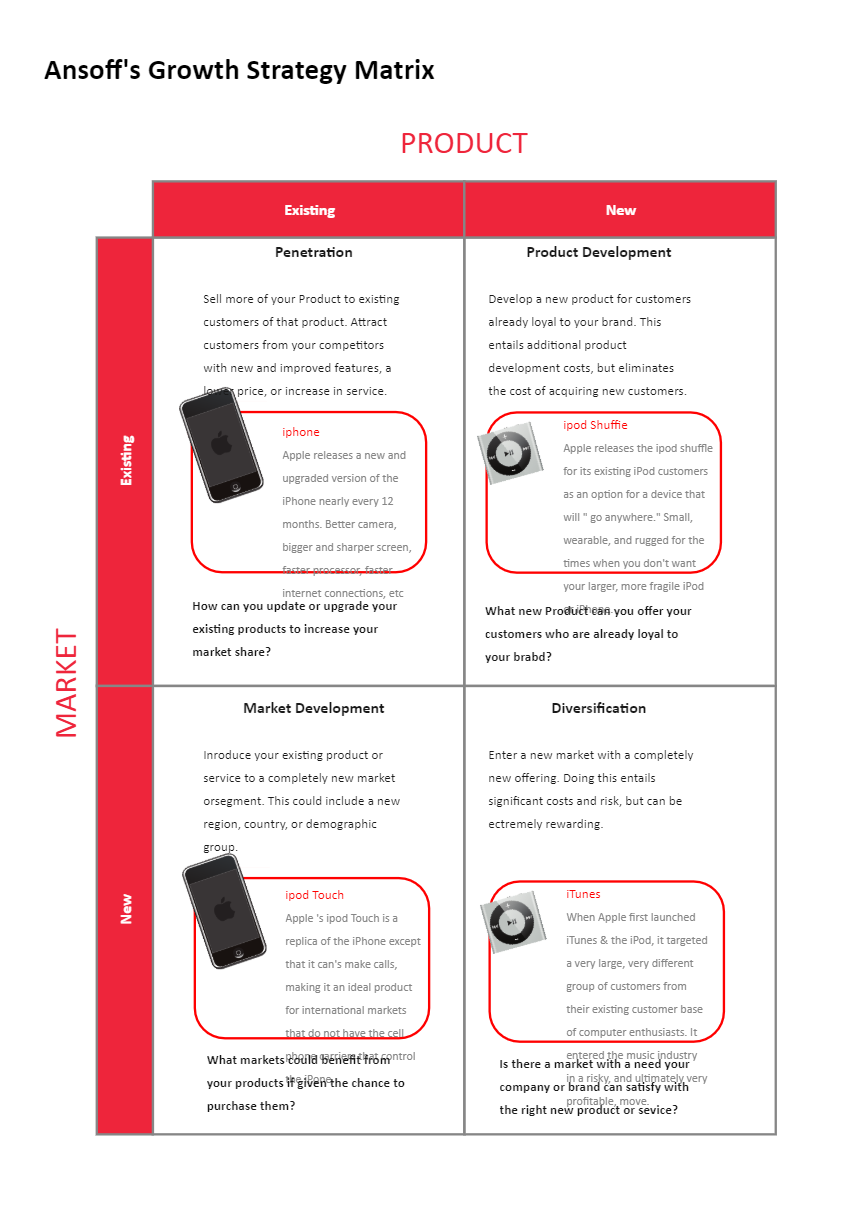
Although Apple is an established brand, it is rapidly scaling its business globally. Advancement in technology and the renowned brand name have attracted customers worldwide. The Apple Ansoff matrix will help the multinational technology company determine its product and market strategy for further growth. As you see in the below Ansoff matrix diagram, the Apple matrix shows four strategies that can help a firm grow and analyzes the risk associated with each strategy.
According to the Apple Ansoff Matrix Diagram, Apple releases a new product almost every year with advanced technology, which helps the global technology giant stay relevant.
As per the diagram, Apple released iPod shuffle for existing iPod users, which was marketed to be pocket-sized and wearable.
Market development is essential for the growth of the company. Apple launched the iPod Touch, a replica of the iPhone, making it the ideal product for international markets that do not have the cell phone carriers that support the iPhone.
Diversification is considered to be the riskiest strategy. To date, Apple has engaged in the diversification process occasionally. The company launched iTunes for music lovers. It was very different from their existing base of computer enthusiasts. Apple Ansoff's diagram suggests that it turned out to be a very profitable move.
3. How to Create a Matrix Diagram
Creating a matrix diagram in EdrawMax Online is pretty simple. The free matrix diagram maker has several features as you can instantly import the images or icons from your system or Google Drive or DropBox. The matrix diagram maker lets you import the data right from the .csv file, or you can also import media content, like images, icons, or symbols, right from your Google Drive or DropBox.
Step 1: Login EdrawMax Online
Log in EdrawMax Online using your registered email address. If this is your first time accessing the tool, you can create your personalized account from your personal or professional email address.
Step 2: Choose a template
EdrawMax Online comes with hundreds of free matrix diagram templates. Select a pre-designed template by entering the Keyword in the "Search"" section or exploring different diagram sets. In this case, you will find the matrix diagram under the ""Business"" section diagram types. Alternatively, you can simply click on ""+"" in EdrawMax Online canvas to create a diagram of your preference.
Step 3: Customize the diagram
Customize your matrix diagram by adding the relevant data based on the research or your information from your business team (sales, marketing, operations, and management).
Step 4: Export & Share
Once your required matrix diagram is completed, you can share it amongst your colleagues or clients using the easy export and share option. You can further export the diagram in multiple formats, like Graphics, JPEG, PDF, or HTML. Also, you can share the designs on different social media platforms, like Facebook, Twitter, LinkedIn, or Line.
The Ansoff Matrix is a tool used by companies to analyze and plan their strategy for growth. It is also known as the Product Expansion Grid. The Ansoff Matrix was developed by applied mathematician and business manager H. Igor Ansoff. It was published in the Harvard Business Review in 1957. It offers the company an uncomplicated and efficient way of analyzing options and risks involved when taking new strategic decisions. The Apple Ansoff Matrix will be discussed in this article extensively.
2. Understand Apple Ansoff Matrix
Although Apple is an established brand, it is rapidly scaling its business globally. Advancement in technology and the renowned brand name have attracted customers worldwide. The Apple Ansoff matrix will help the multinational technology company determine its product and market strategy for further growth. As you see in the below Ansoff matrix diagram, the Apple matrix shows four strategies that can help a firm grow and analyzes the risk associated with each strategy.
According to the Apple Ansoff Matrix Diagram, Apple releases a new product almost every year with advanced technology, which helps the global technology giant stay relevant.
As per the diagram, Apple released iPod shuffle for existing iPod users, which was marketed to be pocket-sized and wearable.
Market development is essential for the growth of the company. Apple launched the iPod Touch, a replica of the iPhone, making it the ideal product for international markets that do not have the cell phone carriers that support the iPhone.
Diversification is considered to be the riskiest strategy. To date, Apple has engaged in the diversification process occasionally. The company launched iTunes for music lovers. It was very different from their existing base of computer enthusiasts. Apple Ansoff's diagram suggests that it turned out to be a very profitable move.
3. How to Create a Matrix Diagram
Creating a matrix diagram in EdrawMax Online is pretty simple. The free matrix diagram maker has several features as you can instantly import the images or icons from your system or Google Drive or DropBox. The matrix diagram maker lets you import the data right from the .csv file, or you can also import media content, like images, icons, or symbols, right from your Google Drive or DropBox.
Step 1: Login EdrawMax Online
Log in EdrawMax Online using your registered email address. If this is your first time accessing the tool, you can create your personalized account from your personal or professional email address.
Step 2: Choose a template
EdrawMax Online comes with hundreds of free matrix diagram templates. Select a pre-designed template by entering the Keyword in the "Search"" section or exploring different diagram sets. In this case, you will find the matrix diagram under the ""Business"" section diagram types. Alternatively, you can simply click on ""+"" in EdrawMax Online canvas to create a diagram of your preference.
Step 3: Customize the diagram
Customize your matrix diagram by adding the relevant data based on the research or your information from your business team (sales, marketing, operations, and management).
Step 4: Export & Share
Once your required matrix diagram is completed, you can share it amongst your colleagues or clients using the easy export and share option. You can further export the diagram in multiple formats, like Graphics, JPEG, PDF, or HTML. Also, you can share the designs on different social media platforms, like Facebook, Twitter, LinkedIn, or Line.
Tag
ansoff matrix
Matrix Diagram Collection
Share
Report
7
4.2k

Post
Recommended Templates
Loading
