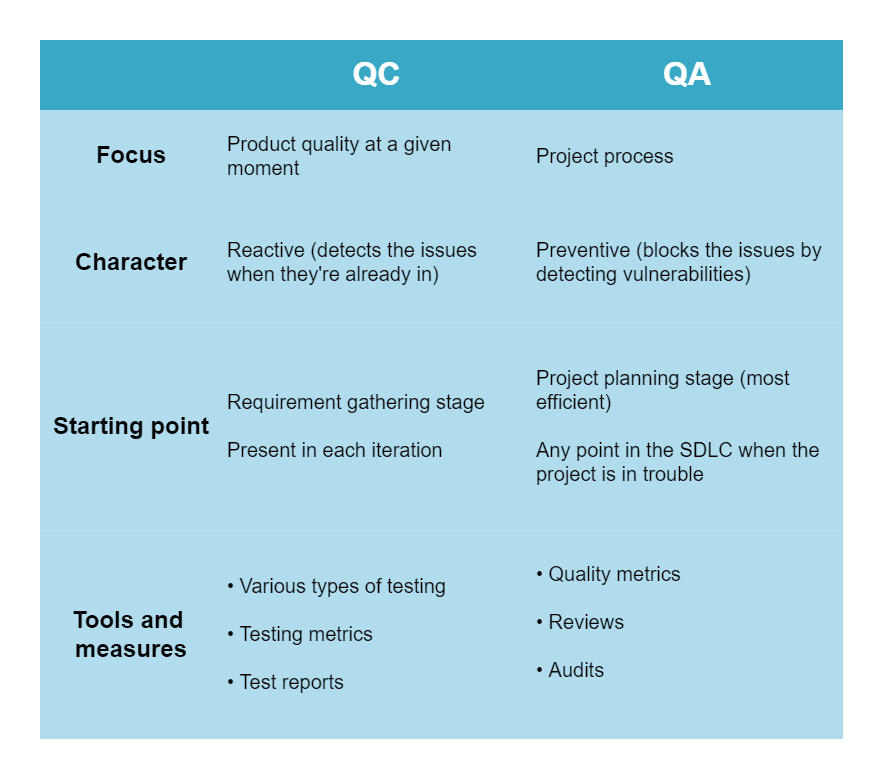
This comparison chart discusses the concepts of quality assurance (QA) and quality comparison (QC) regarding four key points. These reference points are focus, character, starting point, and lastly, tools and measures. The chart shows how QA and QC would behave against each reference point. For example, in the case of focus, QC would be on a given product at a given point in time. But in the case of QC, it would be on the whole production process and not just a single product. The primary character of QC is that it is reactive; it sets in when a problem has already surfaced, but in QA, it would be proactive, as it prevents the problem from occurring in the first place.


 Desktop