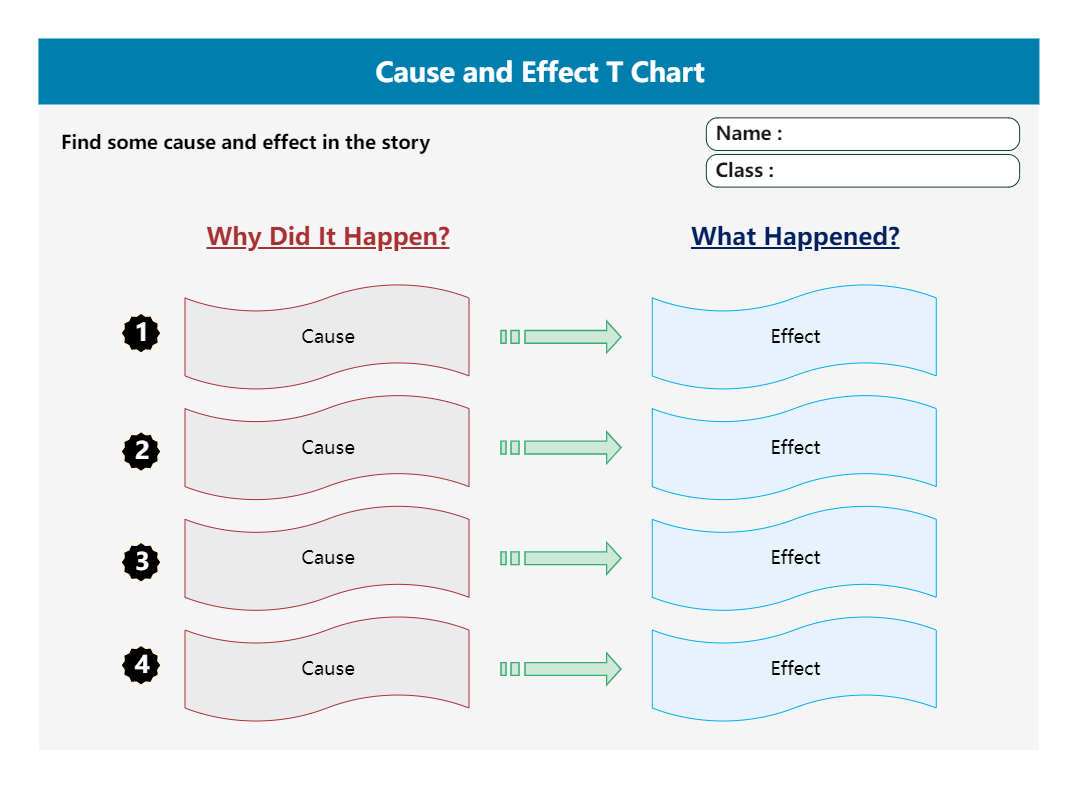
This diagram represents a cause and effect T-chart. Through cause and effect we can know a slew of possibilities for a given problem's origin. It is a pictorial representation of a result and the different factors that shape that result. To look for a possible relationship between a cause and an effect, we examine a happening and determine what caused it in the first place. There is always this possibility that there can be more than one cause and effect. An example of cause and effect could be putting on weight because of reckless eating. Here the weight is the effect, and eating is the cause, but the effect could be the result of other causes like genetic disposition, certain metabolic conditions, etc.


 Desktop