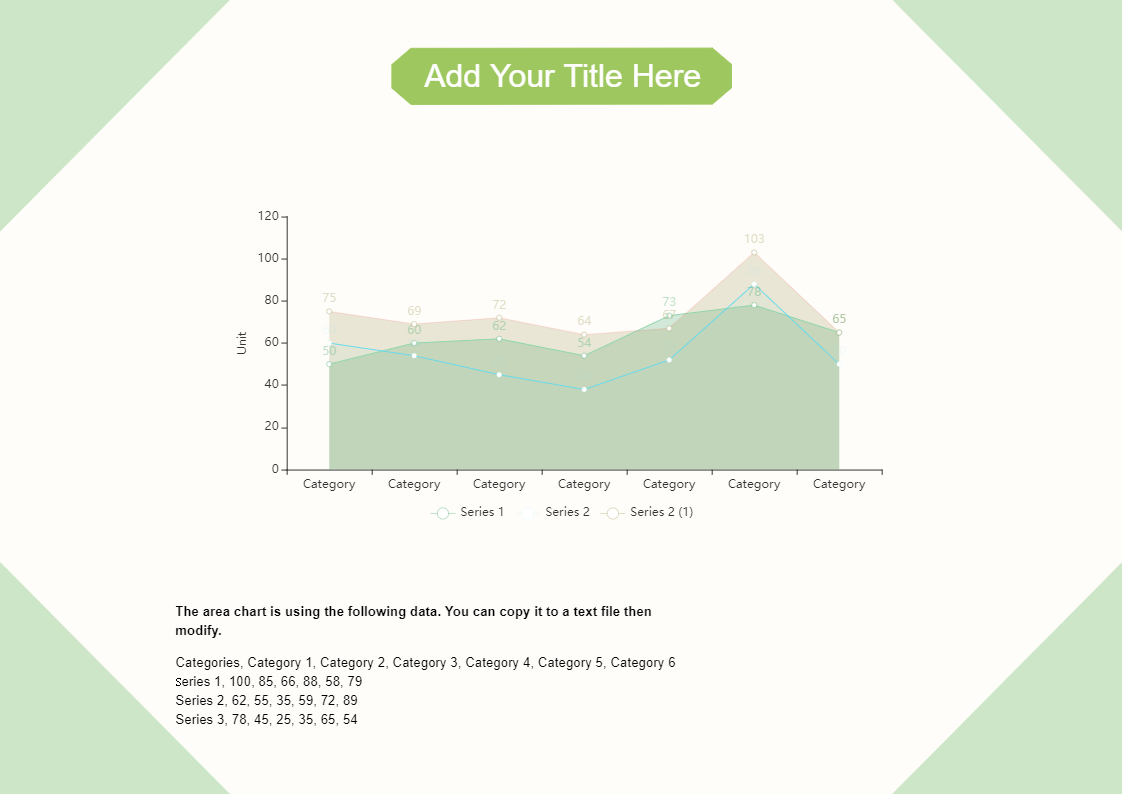
An area chart combines the line chart and bar chart to show how one or more groups/ series numeric values change over the progression of a second variable, typically that of time. An area chart is distinguished from a line chart by the addition of shading between lines and a baseline, like in a bar chart. Values for each timeframe can be measured not just from the vertical position of the top of the shape, but also the coloured height between the baseline and top. In this, more the amount of data series in overlapping chart then more combinations of colours will be. The following template is an overlapping area chart is drawn in EdrawMax online. This chart represents three series with six different data categories are shown. All the dummy text is replaceable, even the background colour and you can easily add or delete category, this intern changes the area chart. And also, EdrawMax lets you add/ load data from existing file and set min and max values for X-axis along with different appearance options. Instead of creating the area chart from scratch, use EdrawMax online as it provides pre-defined templates, shapes, and figures which will help you create the area chart with ease.


 Desktop