
Templates Community /
100% Stacked Bar Chart
100% Stacked Bar Chart
Joy
Published on 2021-12-24

 Desktop

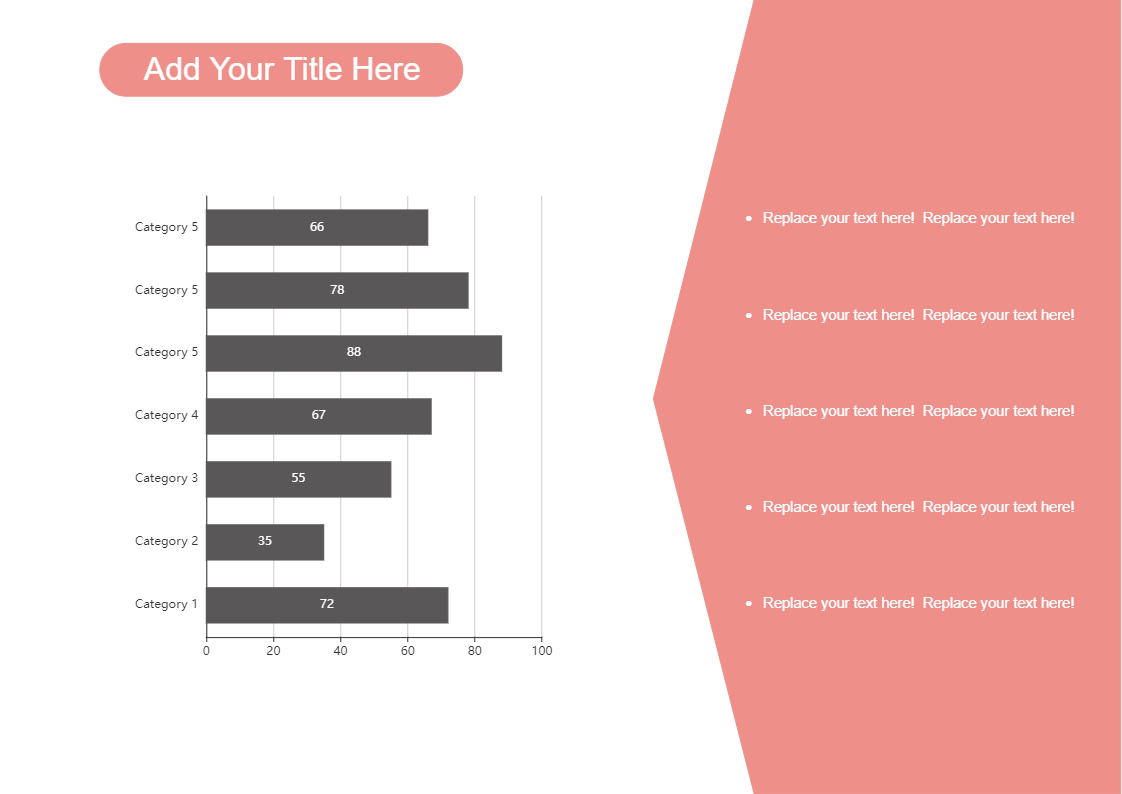
A bar chart or bar graph is a chart that presents categorical data with rectangular bars with heights or lengths proportional to the values that they represent. The bars can be plotted vertically or horizontally. A vertical bar chart is sometimes called a column chart. The most usual type of bar graph is vertical. The bar chart usually compares different categories. In column chart the horizontal (x) axis represents the categories and the vertical (y) axis represents a value for those categories. It is vice a versa for horizontal chart. The following graph is a horizontal stacked bar chart. The following bar chart is 100% Stacked Bar Charts which displays the comparison of the percentage each part of the category to the whole category, taking the whole category as 100%. So, each of the category shows its relative contribution (in percent) to the entire bar and the entity as a whole. In this chart seven different categories are mapped. And there is ample place at right of the chart to add the details / description for the series/ chart along with the header on top. This template has been drawn using EdrawMax online. All the dummy text is replaceable, even the background colour and you can easily add or delete category, this intern changes the bar chart. And also, EdrawMax lets you load data from existing file and set max values with different appearance options. Instead of creating the bar chart from scratch, use EdrawMax online as it provides pre-defined templates, shapes, and figures which will help you create the bar chart with ease.
Tag
bar chart
bar graph
Share
Report
1
278

Post
Recommended Templates
Loading
