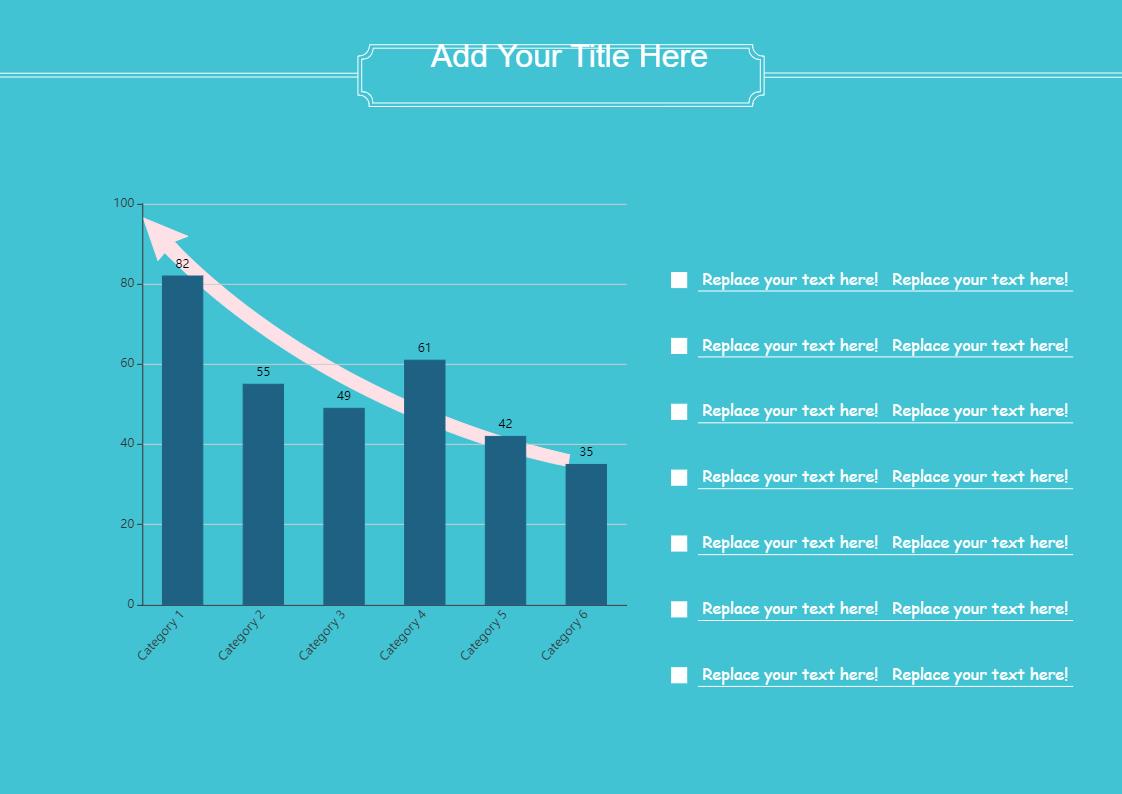
A column chart is a data visualization where each category is represented by a rectangle, with the height of the rectangle being proportional to the values being plotted. Column charts are also known as vertical bar charts. It is one of the most common charts used in the field of Data Visualization and one of the easiest to understand. This chart contains of a simple column chart data representing for five different categories along with a trend arrow (curved arrow) on top off cyan canvas. There is also place to add header for the chart along with place to detailed description on the right side. All the dummy text in this diagram is replaceable, even the background colour and you can easily add or delete category, this intern changes the column chart. And also, EdrawMax lets you load data from existing file, set max values for axis and allows to choose different appearance option. Instead of creating the cluster column chart from scratch, use EdrawMax online as it provides pre-defined templates, shapes, and figures which will help you create the chart with ease.


 Desktop