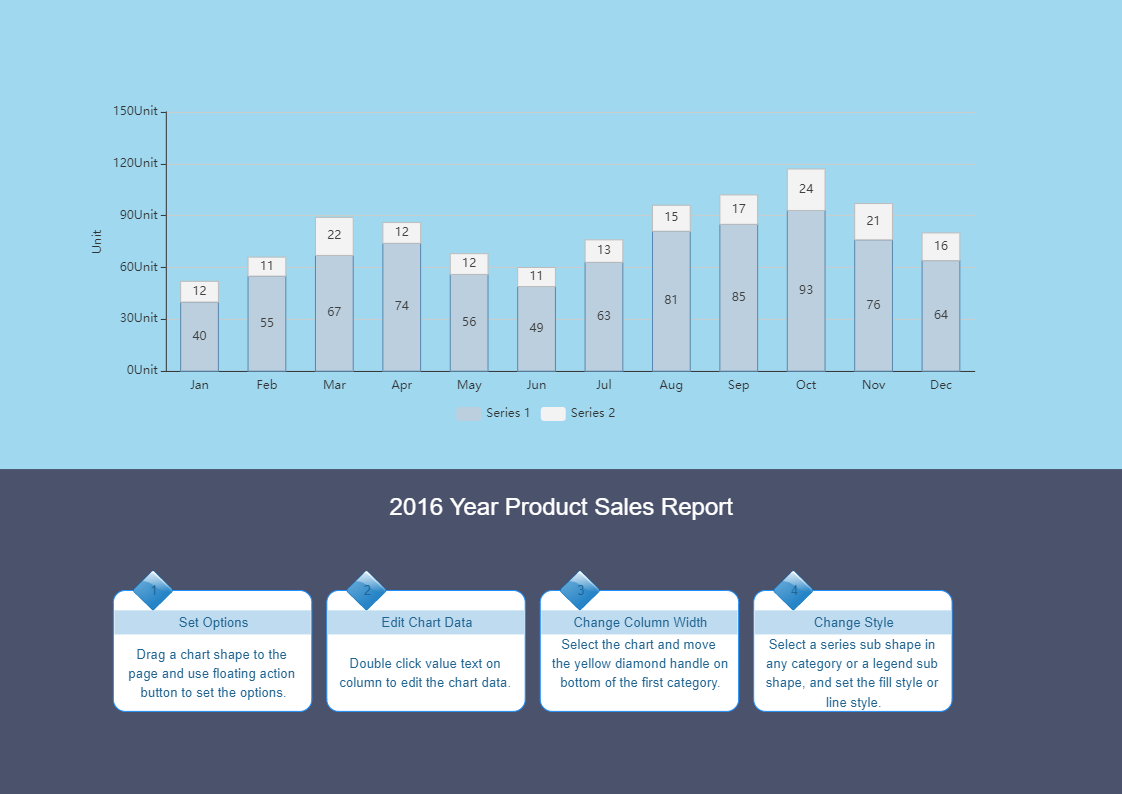
The stacked bar chart/ stacked bar graph extends the typical bar chart from looking at numeric values across one categorical variable to another. Each bar in a standard bar chart is divided into a number of sub-bars stacked one above the other. A Stacked Bar Graph is used to show how a larger category is divided into smaller categories and what the relationship of each part has on the total amount. It also enables you to see the contribution from different categories to each bar or group of bars in the bar chart. This template shows comparison of three series/ parameter with one another with help of stacked bar chart. This chart contains of a stacked column chart data representing for 12 different categories / months along for 2 different series / categories of data on top off cyan and blue canvas. There is also place to add header for the chart along with place and detailed description on the bottom half of the template. All the dummy text in this diagram is replaceable, even the background colour and you can easily add or delete category, this intern changes the column chart. And also, EdrawMax lets you load data from existing file, set max values for axis and allows to choose different appearance option. Instead of creating the cluster column chart from scratch, use EdrawMax online as it provides pre-defined templates, shapes, and figures which will help you create the chart with ease.


 Desktop