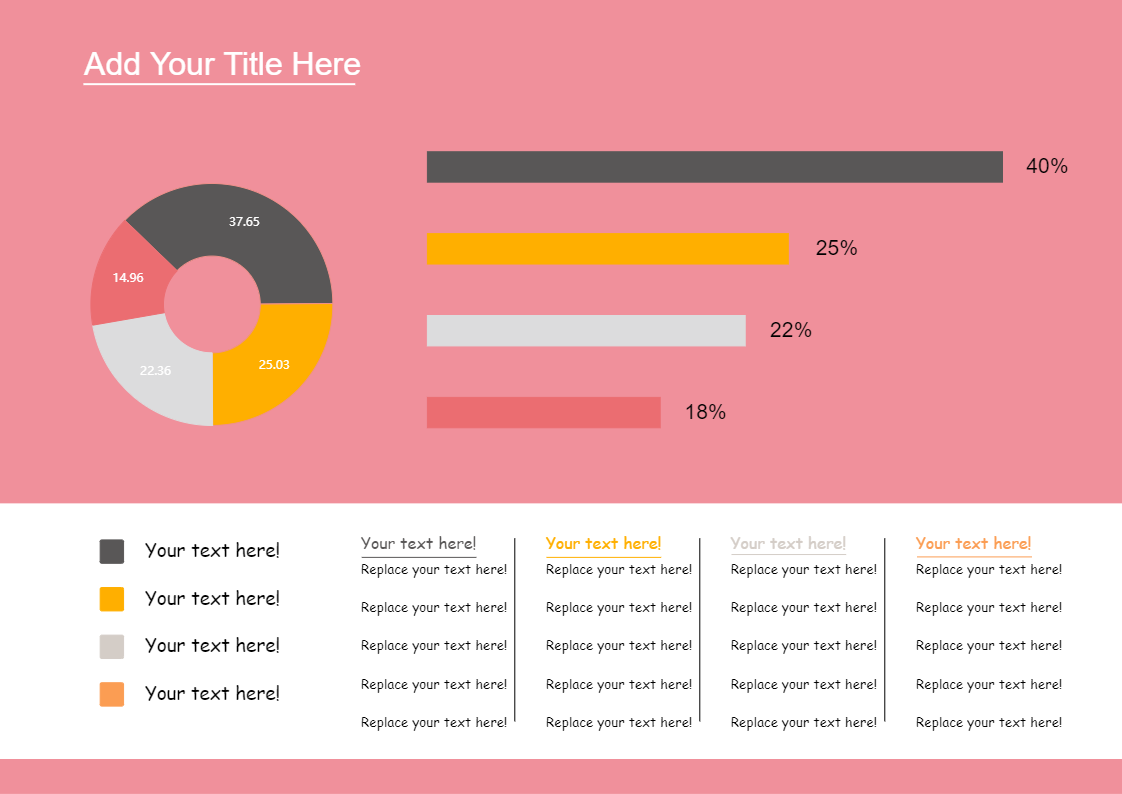
This template consists of a doughnut chart and a bar chart. The doughnut chart used here is a nested doughnut chart also known as a multi-series doughnut chart. It allows you to display multiple series in a single visualization. The series are usually related but represent different categories or slices of data, like the distribution of some category values over different years, etc. A bar chart or bar graph is a chart or graph that presents categorical data with rectangular bars with heights or lengths proportional to the values that they represent. The bars can be plotted vertically or horizontally. A vertical bar chart is sometimes called a column chart. Here in this template horizontal char is being used. This particular template has been drawn using EdrawMax online. All the dummy text is replaceable even the background colour and you can easily change the doughnut chart and bar by editing the value, this intern changes the chart automatically. Instead of creating the chart from scratch, use EdrawMax online as it provides pre-defined templates, shapes, and figures which will help you create the chart with ease.


 Desktop