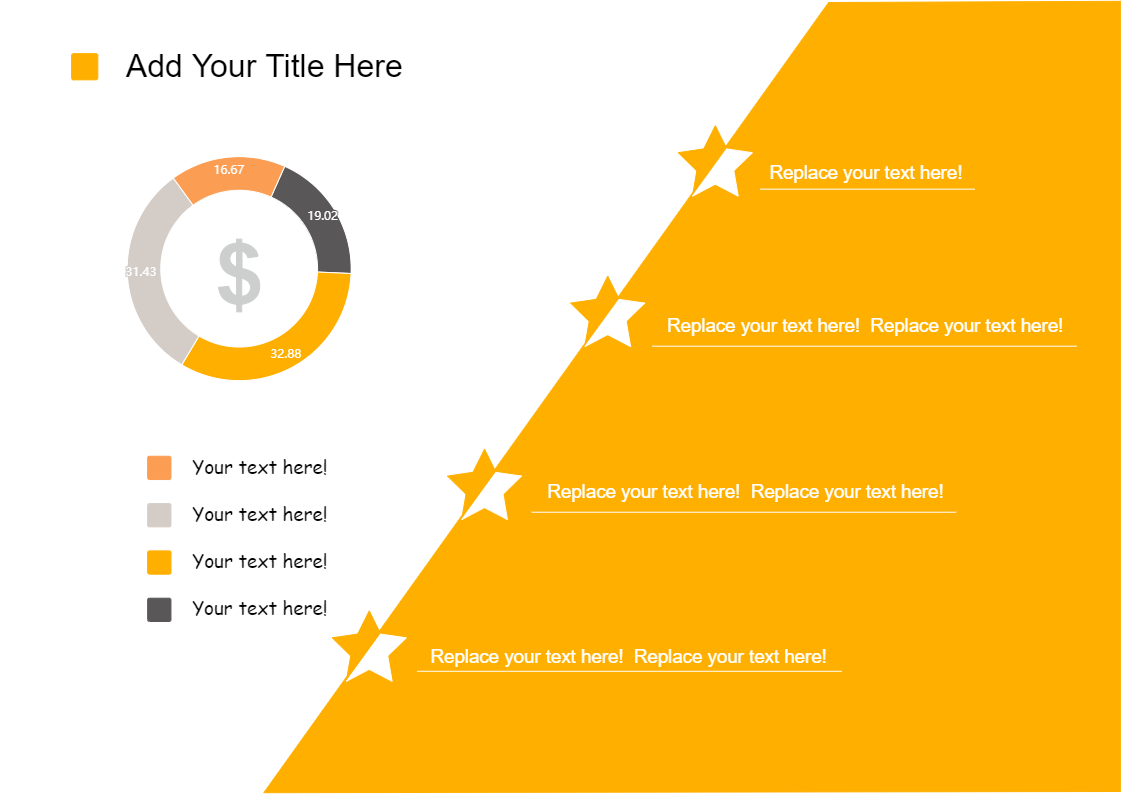
Doughnut charts are used to show the proportions of categorical data, with the size of each piece representing the proportion of each category. The doughnut chart is a variant of the pie chart, with a hole in its centre, and it displays categories as arcs rather than slices. The centre of the doughnut chart can be used to render additional information like the total of all data values as well as the data value of the slice. The following template has a nested doughnut chart with the list and this is drawn using EdrawMax online. All the dummy text in the template is replaceable and even the background colour. You can easily change the doughnut chart by editing the value. Instead of creating the chart from scratch, use EdrawMax online as it provides pre-defined templates, shapes, and figures which will help you create the chart with ease.


 Desktop