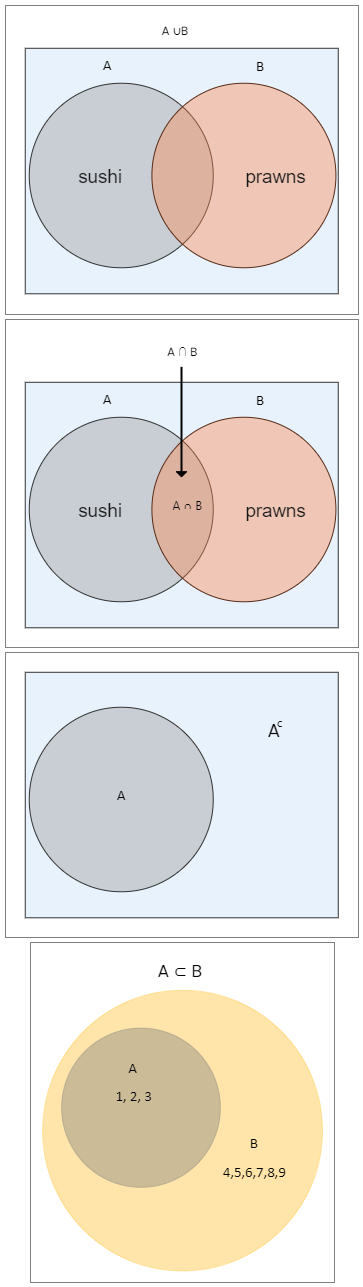
The symbol ꓵ between two sets represents only similar elements. It shows the elements that are only in both sets.
A Venn diagram is a visual representation of similarities and differences between two or more concepts. It depicts relationships between two or more sets of data by using circles as an illustration. Each circle represents one particular set of data. Overlapping circles represent the similarities, while detached circles represent the difference between sets or concepts.
With the help of a Venn diagram, you can easily describe any relationship between two or more concepts. Using circles for the representation of data makes it simple to depict similarities between two or more factions. That is why these diagrams are typically used for business presentations, logic studies, and mathematics.


 Desktop