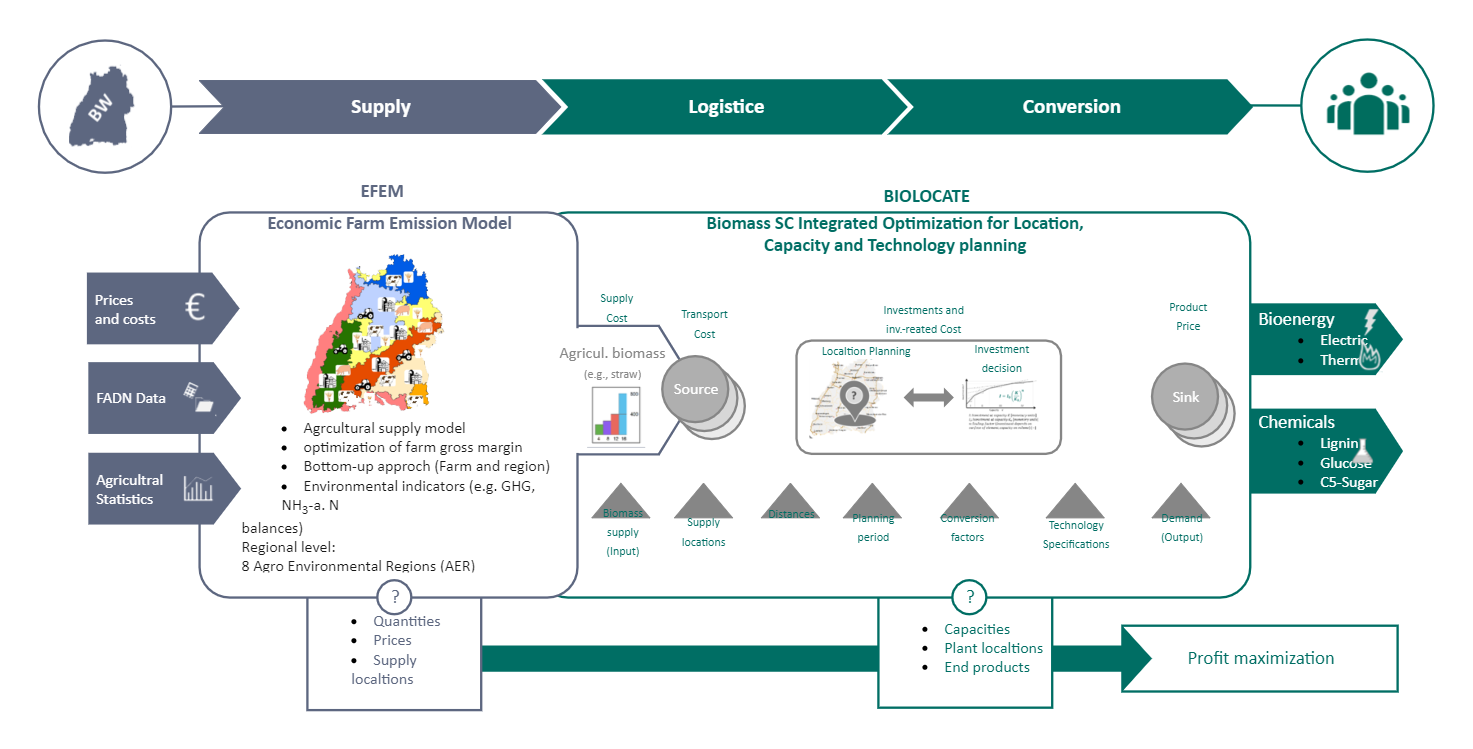
The following Value Chain diagram presents the linkage of a farm model (EFEM) and a techno-economic location optimization model (BIOLOCATE) for evaluating the straw-to-energy and the innovative straw-to-chemical value chains in the German federal state of Baden-Wuerttemberg, taking into account the spatially distributed and price-sensitive nature of straw supply. The general results reveal the basic trade-off between economies of scale of the energy production plants and the biorefineries on the one hand and the feedstock supply costs on the other hand. The results of the farm model highlight the competition for land between traditional agricultural biomass utilization such as food and feed and innovative biomass-to-energy and biomass-to-chemical value chains. EdrawMax is one of the leading free value chain diagram makers in the market. The free value chain diagram maker has tons of predefined templates that allow you to customize the layout as per your requirement. You can also choose to create the value chain diagram from scratch if you want, as EdrawMax has free value chain symbols that make the entire process extremely easy.


 Desktop