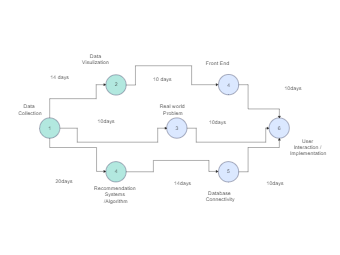
This Data Processing and Implementation Flowchart, created with EdrawMax, outlines a step-by-step process from data collection to user implementation. It covers phases including data visualization, addressing real-world problems, building recommendation systems, and ensuring database connectivity, leading up to front-end and user interaction. Each phase is associated with specific timeframes to provide a comprehensive overview of project progression and timeline management. This flowchart is perfect for project managers, data scientists, and software developers who need to visualize the sequential tasks in data-driven projects.