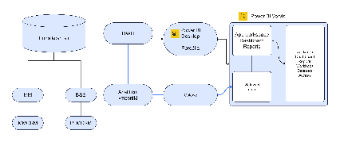
Designed with EdrawMax, this template illustrates a data analytics architecture centered around Power BI. It begins with a “Podatkovni vir” (data source), which feeds into a “DWH” (Data Warehouse). Data then moves to “Power BI Desktop” for creating “Poročila” (reports). The reports are uploaded to “Power BI Servis,” which includes an “App workspace” with “Dashboard” and “Reports.” There are also elements like “Analitični vmesniki” (analytical interfaces) and a “Gateway” for data transfer. Sub - components such as “MM,” “BSS,” “MMCRM,” and “PLMCRM” are part of the data sources. This diagram is useful for understanding the end - to - end data flow and architecture in a Power BI - enabled data analytics setup.


 Desktop