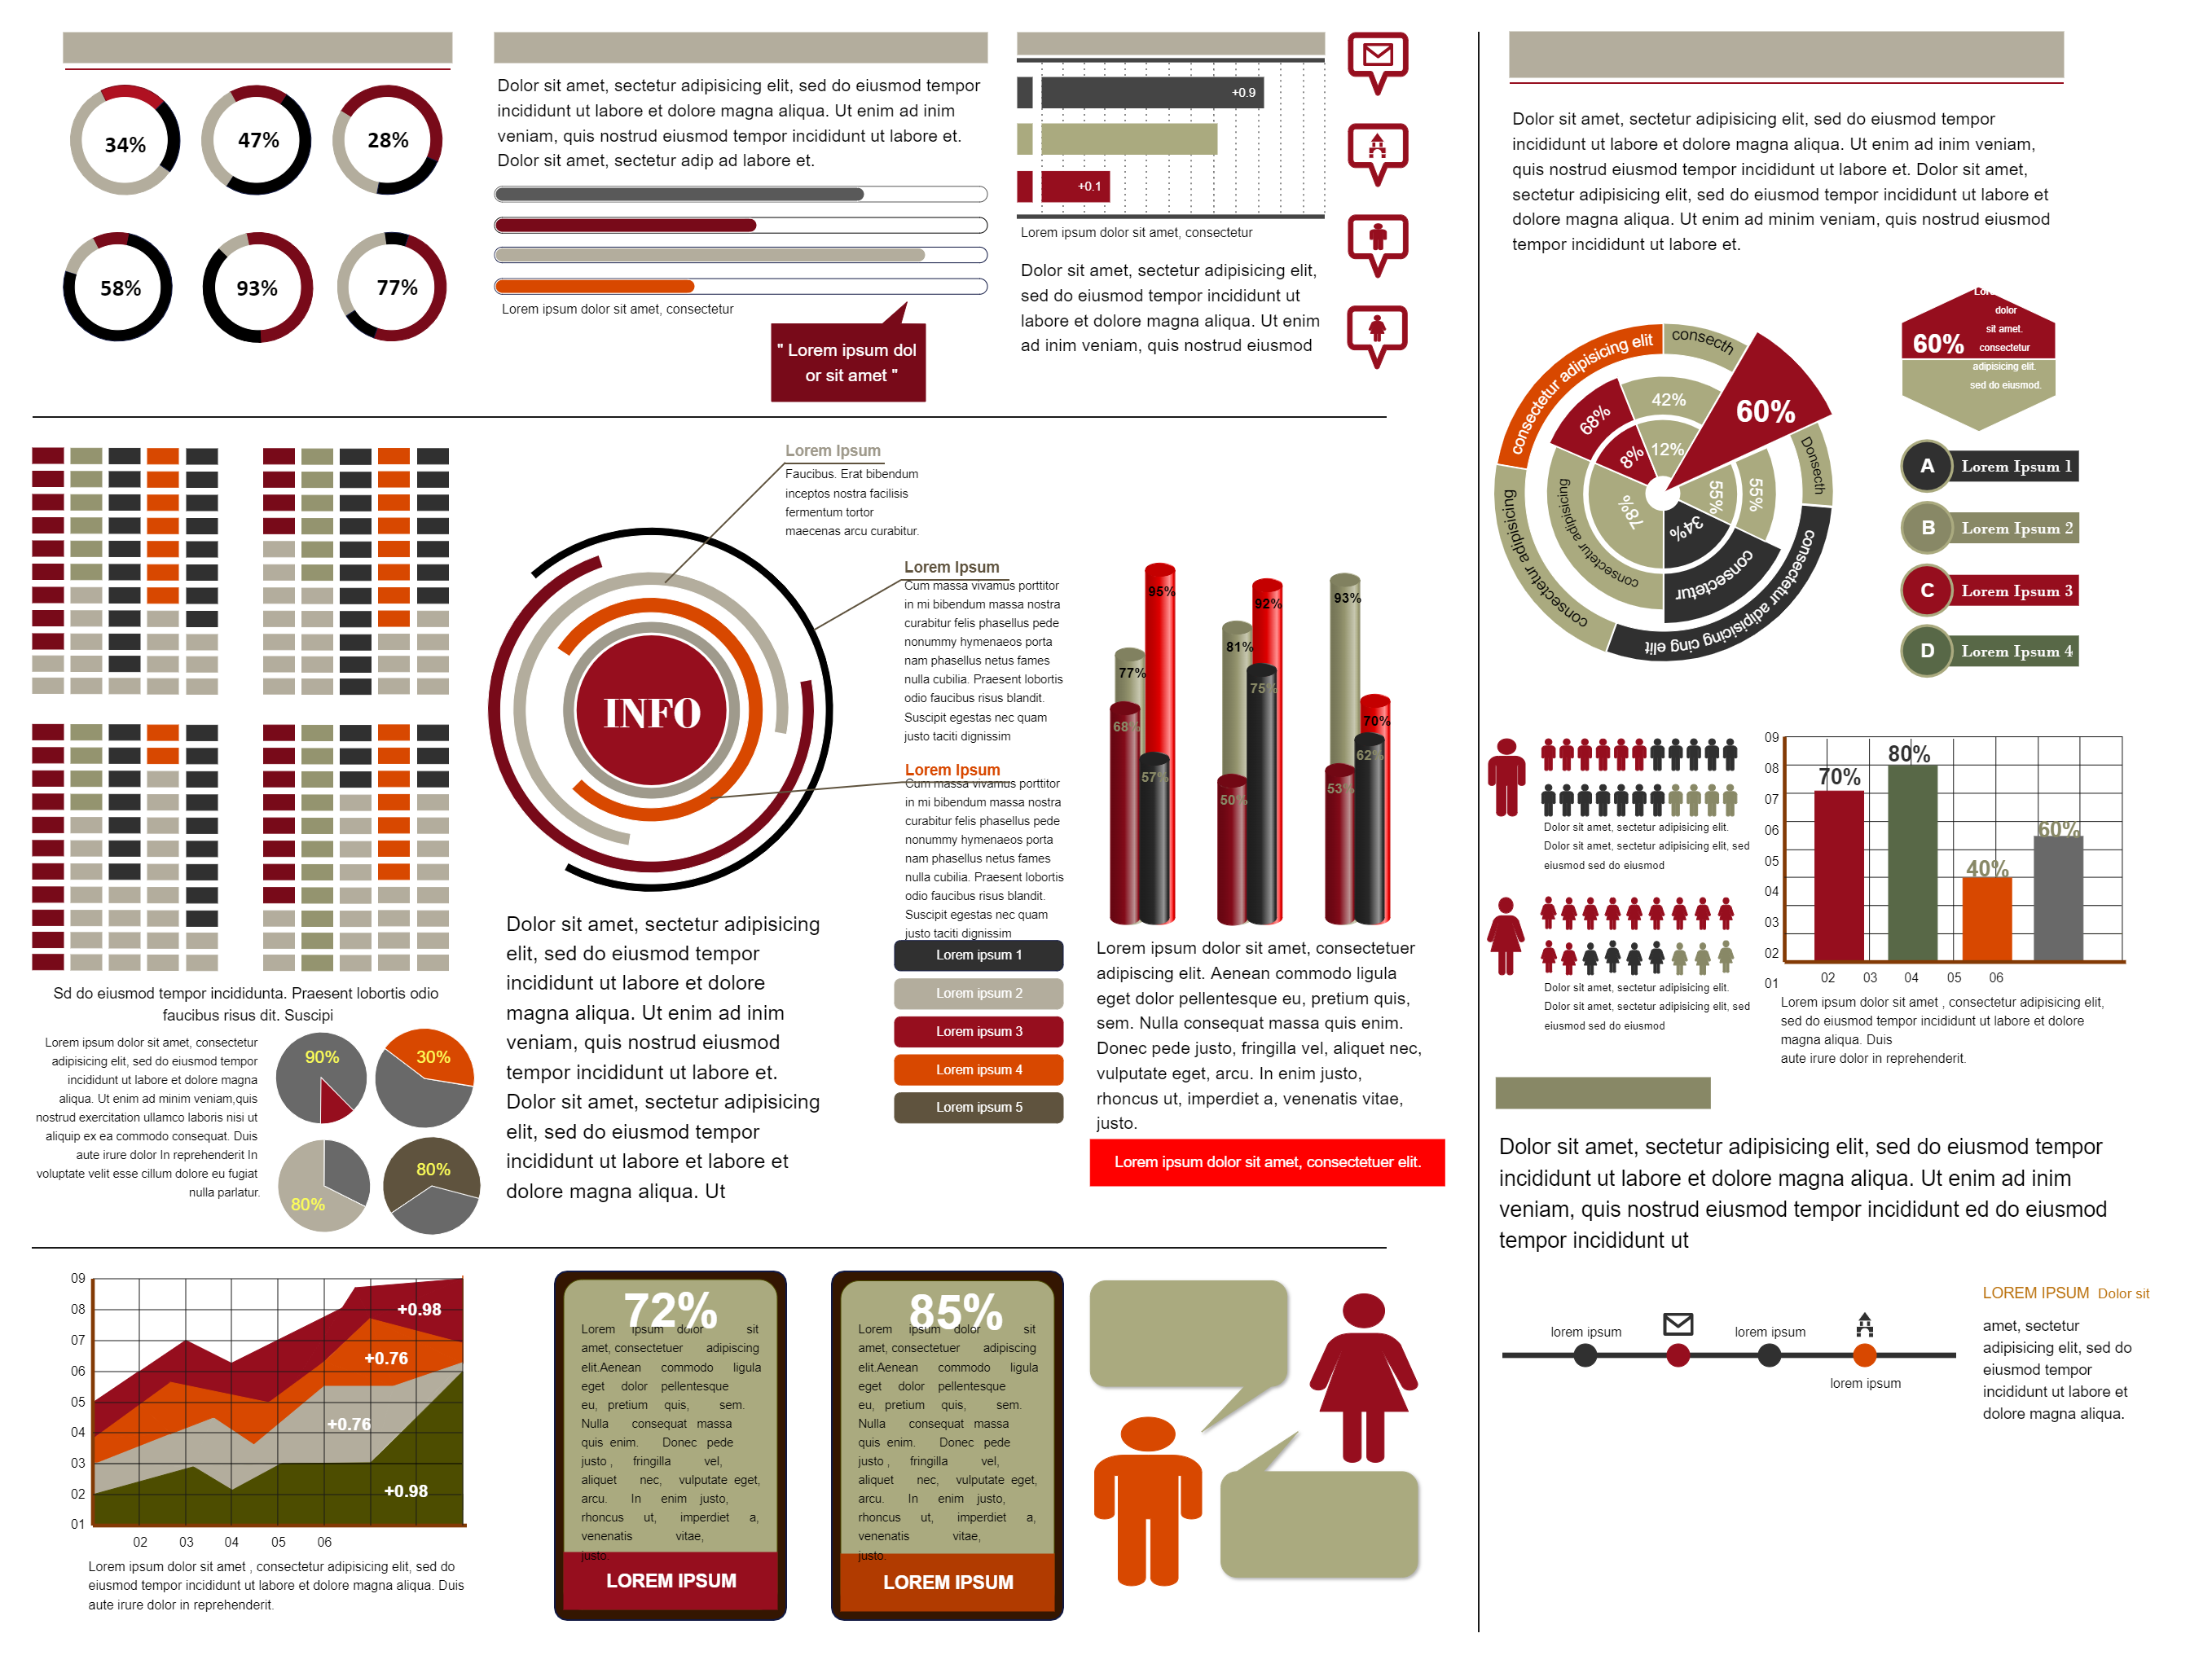
As the definition goes by, an infographic is a collection of data visualization and minimal text that explains the topic at hand. Below is the infographic chart illustrating several different segments, ranging from Objectives, Introduction, Method, Discussion, Q&A, Result/Conclusion, References, and more. As graphically illustrated here, you can have multiple segments and illustrations, like charts, graphs, Venn Diagrams, and more, to correctly convey your research paper. You can use EdrawMax Online to create infographic poster presentations for your research papers. The tool offers over 250 different diagrams -- and all such different diagrams can be incorporated into one single design.


 Desktop