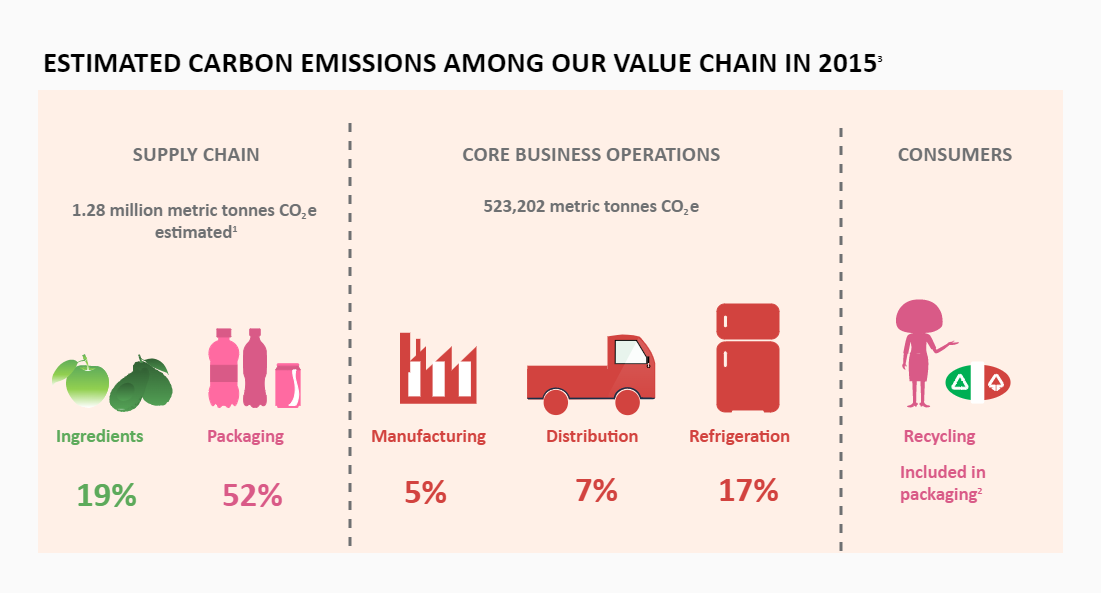
The estimated carbon emissions across the Coca-Cola value chain in 2015 are depicted in this diagram of the Coca-Cola supply chain. Approximately 1.28 million metric tonnes of carbon were estimated during the supply chain process, which included 19% ingredients and 52% packaging. In contrast, during core business operations, a total of 523,202 metric tonnes of CO2 were estimated, which included 5% manufacturing, 7% distribution, and 17% refrigeration. Coca-Cola is still one of the most popular beverages globally, and it is one of the most well-known brands. This Coca-Cola Supply Chain Diagram depicts the entire process, beginning with acquiring raw materials, including agricultural products.


 Desktop