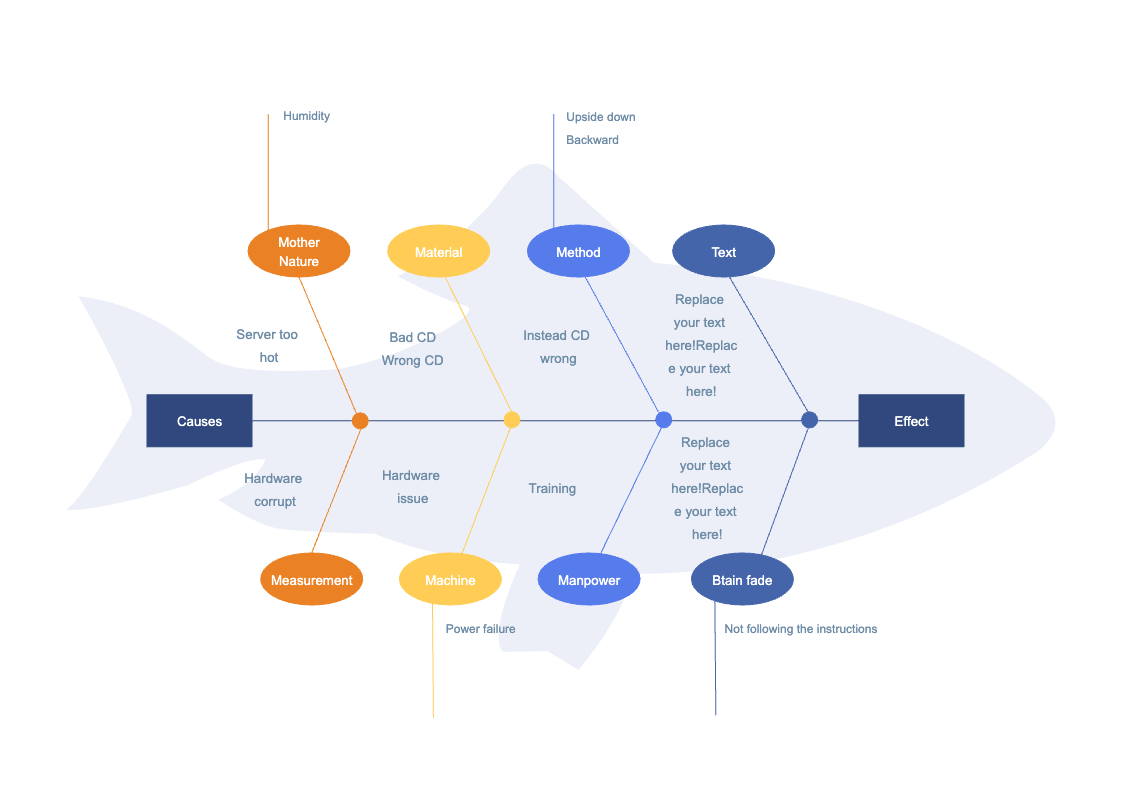
The Fishbone Diagram, also known as an Ishikawa diagram, visually represents the different possible causes of a problem. In this case, the problem being addressed is the inability to load software onto a computer system. The diagram is structured like a fishbone, with the problem statement at the head of the fish and the possible causes branching out from the spine. The branches include hardware, software, user error, and external factors such as network connectivity. Each branch can be further broken down into subcategories, such as specific hardware components or software versions. Using a Fishbone Diagram to map out the potential causes of the problem, it becomes easier to identify the root cause and develop an effective solution. Create a similar diagram using EdrawMax. Once you have customized the EdrawMax template, you can share it in different formats per your requirements.


 Desktop