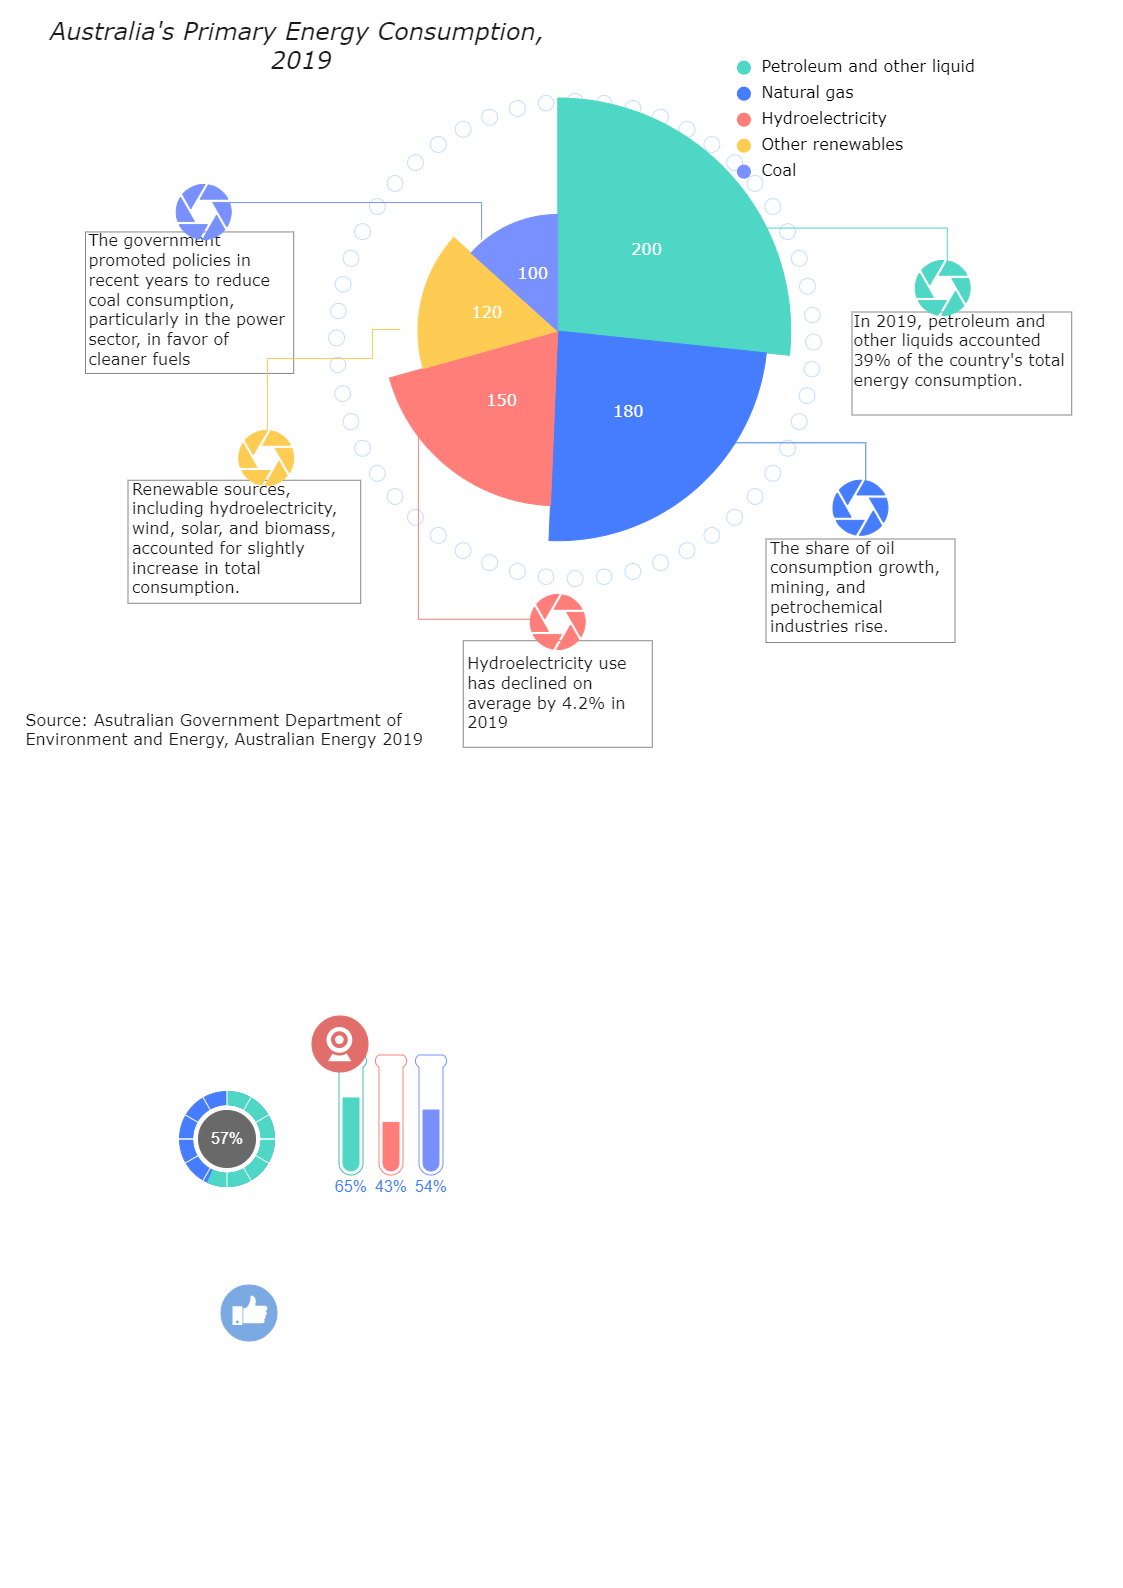
Energy consumption chart is shown here. A Pie Chart is a sort of graph that shows data in a circular format. The graph's parts are proportionate to the fraction of the total in each category. In other words, each slice of the pie is proportional to the size of that category in the overall group. Pie charts may be used to illustrate percentages at a certain moment in time and can be used to indicate percentages of a whole. Pie charts, unlike bar and line graphs, do not illustrate changes over time.


 Desktop