
Templates Community /
Coco Cola Cause And Effect
Coco Cola Cause And Effect
franciscajoelite@hotmail.com
Published on 2022-03-28

 Desktop

1. Introduction
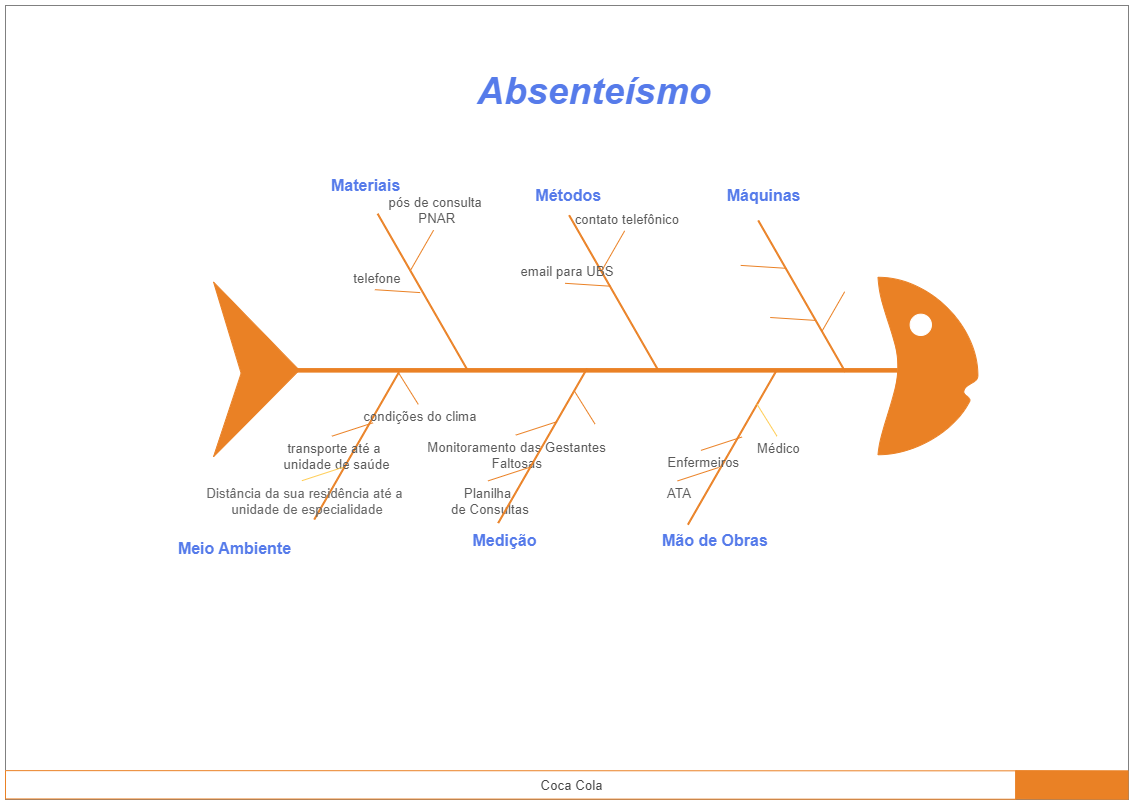
As per the below image, a cause and effect analysis diagram helps one think through the causes of a problem thoroughly, including its possible root causes. It is only by identifying the main causes that one can permanently resolve the issue. A cause and effect diagram is a tool that helps one do this.
2. What is Cause and Effect Diagram
A cause-and-effect diagram is a visual tool for logically organizing probable causes for a specific problem or consequence by graphically portraying them in increasing depth, implying causal links between ideas. A fishbone diagram, often known as an Ishikawa diagram, is a popular kind. A tree diagram can also be used to depict cause-and-effect relationships.
3. How to Create a Cause and Effect Diagram
When constructing cause and effect diagrams, these are the best and most popular practices.
Step 1: Determine the issue. Define the procedure or issue that will be investigated.
Step 2: Brainstorm. All possible reasons should be discussed and categorized.
Step 3: Make a backbone. Draw a straight, horizontal line on the page (this is called the spine or backbone) and a rectangle at the end on the right side once the topic has been determined. In the rectangle, write a brief explanation of the problem.
Step 4: Causes and consequences should be added. Lines branching off at an angle from the main backbone are used to add causes. At the end of the branch, write a description of the cause. This is usually one of the key groups mentioned previously. Sub-categories branching off from the main branch can be used to offer details about the cause or effect. Continue to add branches and a cause or effect until you've documented all of the components. The final product should resemble a skeleton of a fish.
Step 5: Analyze. Once the diagram is finished, assess the information in the manner that it was organized in order to come up with a solution and action items.
Tag
Fishbone Diagram Collection
Share
Report
2
1.5k

Post
Recommended Templates
Loading
