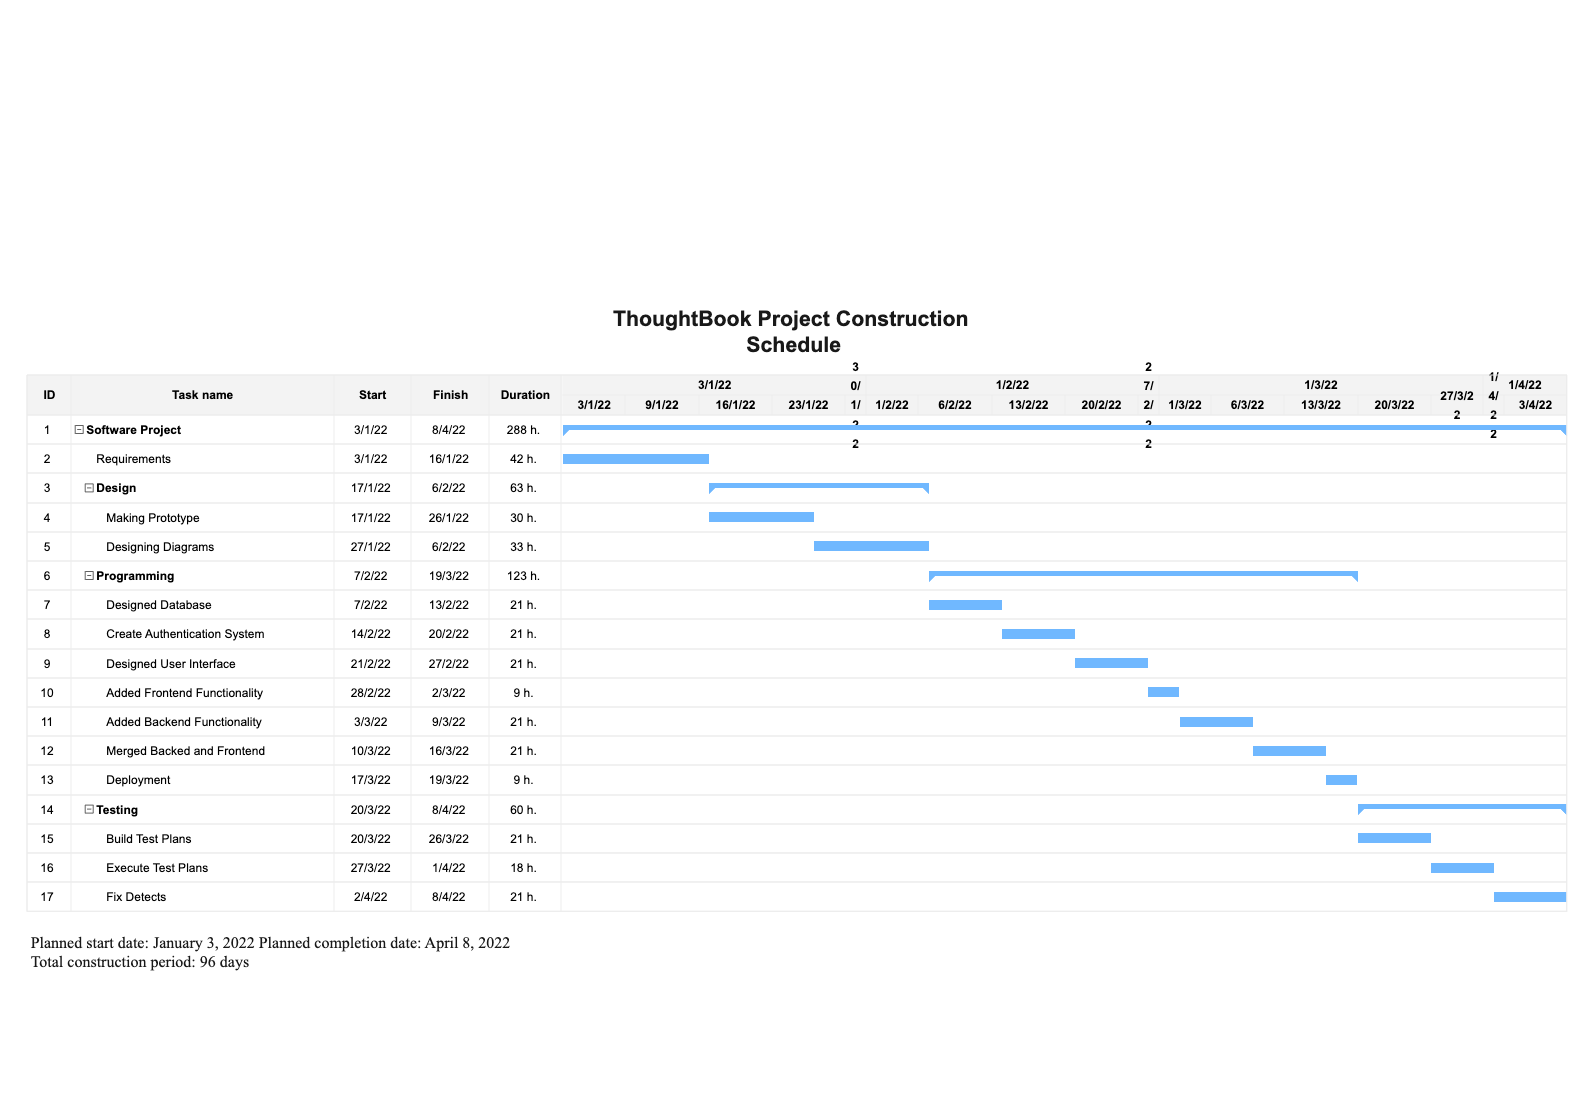
A Gantt Chart is a commonly used tool in software engineering projects to clearly illustrate the tasks and progress of the project. It allows the project manager or team to make informed decisions based on how far along each task is, as well as its timeline and duration. The Gantt Chart will provide an overview of the entire project, enabling teams to adjust tasks accordingly by shifting their completion dates, adding more personnel or resources, or reducing scope. Consequently, this visual representation can be immensely helpful during the planning stage of any software engineering project. EdrawMax lets you recreate similar diagrams effortlessly. Download this template from EdrawMax and customize this template as per your requirements.


 Desktop