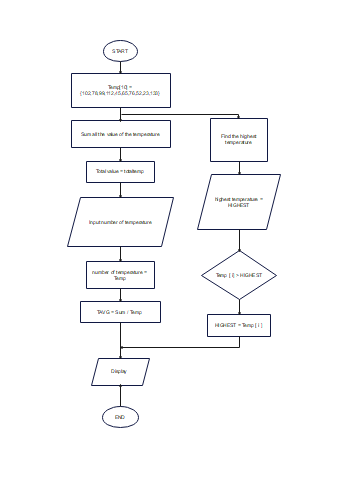
This flowchart presents the detailed steps of aggregating multiple temperature readings and then analyzing the data to identify the highest temperature value. The process encompasses not only data collection and processing but also making judgments and decisions based on the analysis, such as adjusting climate control systems or taking other measures to manage the temperature environment.


 Desktop