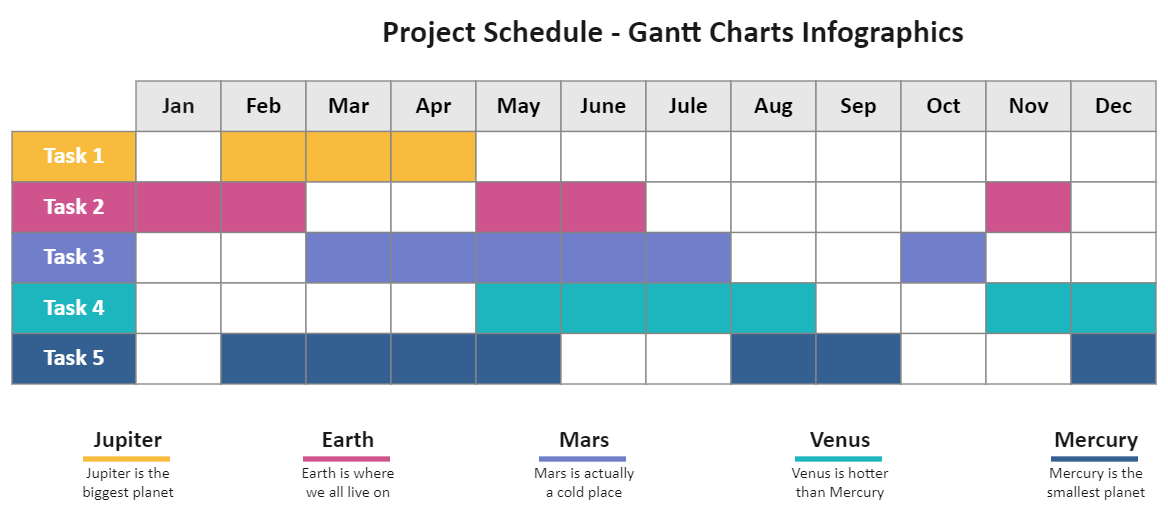
Gantt Chart Powerpoint is a graphical representation of task-based projects. The tasks in a Gantt chart are both tabularly listed and graphically displayed as taskbars, indicating their duration. Visio can automatically adjust the timeline when tasks are delayed or completed ahead of schedule by linking related tasks. This Gantt Chart Powerpoint lists the tasks to be completed, and the horizontal axis shows time intervals. Gantt charts were invented in 1896 and revised in the early 1900s by Henry Gantt. Knowing the anatomy of a Gantt chart will help you improve your project management skills. They are simple to read and comprehend.