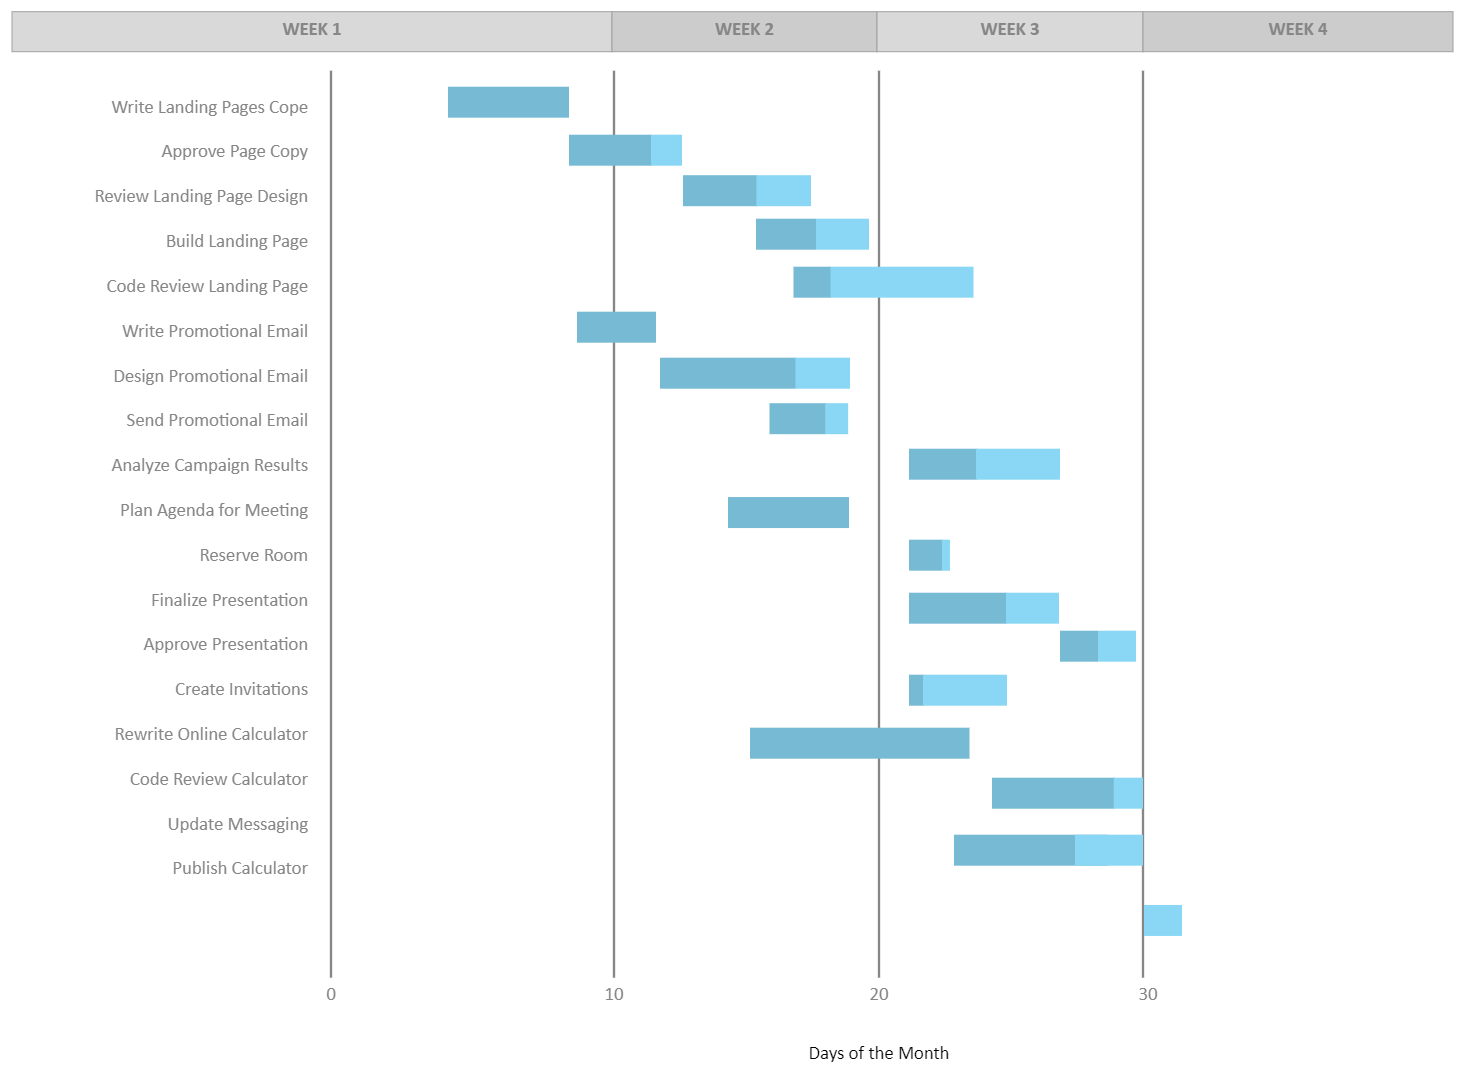
The most commonly used view in Project is the Gantt Chart Powerpoint view. It lists your Project's tasks and uses Gantt bars to show how they relate to the schedule. For new projects, the Gantt Chart view is the default. The primary distinction between a timeline and a Gantt Chart Powerpoint is that a timeline displays events on a single line. In contrast, a Gantt chart is a two-dimensional chart that shows a sequence of tasks and their dependencies. Timelines provide stakeholders with a high-level overview of a project's beginning, end, and key milestones. The chart function in PowerPoint allows you to insert a specific chart or graph directly into a presentation. You can create a stacked bar chart using this method.