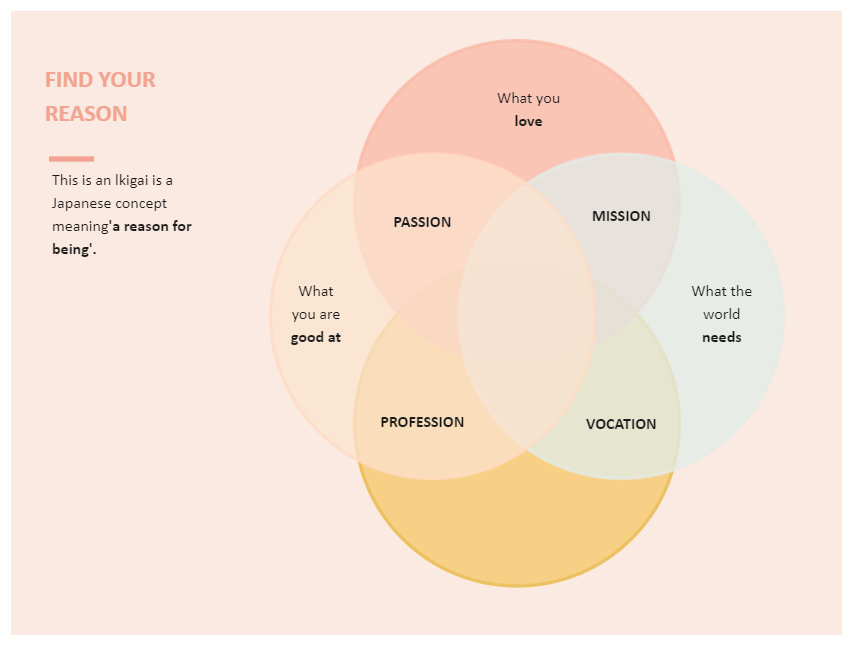
A Venn diagram depicts the similarities and differences between two or more concepts. It uses circles to illustrate relationships between two or more sets of data. Each circle represents a different set of data. The similarities are characterized by overlapping circles, while detached circles represent the differences. A Venn diagram can easily describe any relationship between two or more concepts. The use of circles to represent data makes it easy to depict similarities between two or more factions. Because of this, these diagrams are commonly used in business presentations, logic studies, and mathematics.


 Desktop