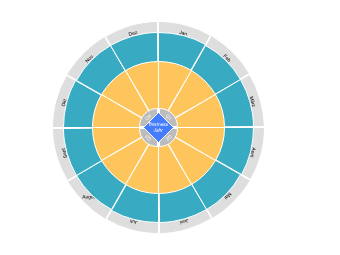
This diagram represents an annual business cycle, visually breaking down the year into four quarters and showing their corresponding months. The cycle is depicted in a circular format with four distinct colors representing each quarter: Q1 (January to March), Q2 (April to June), Q3 (July to September), and Q4 (October to December). The circle is divided into twelve segments, each labeled with the names of the months in German, starting with January ("Jan") and ending with December ("Dez"). This visual arrangement helps in quickly identifying which part of the year corresponds to each business quarter, facilitating planning and review processes within a company.
This map was created by EdrawMax.