
Templates Community /
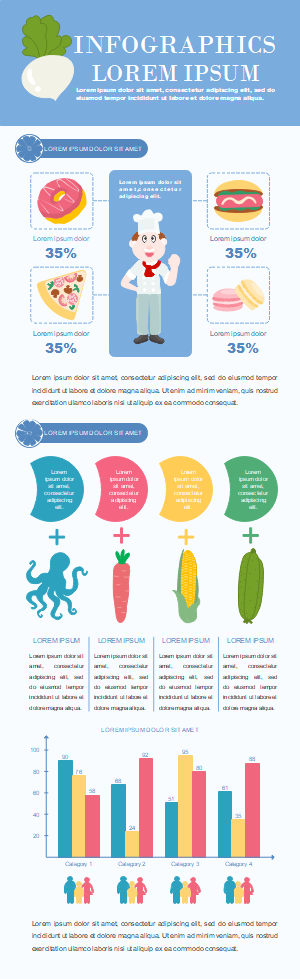
Food Business Infographic Template Restaurant Data Visualization Infographic
Food Business Infographic Template Restaurant Data Visualization Infographic
Published on 2022-04-21

 Desktop


Post
Recommended Templates
