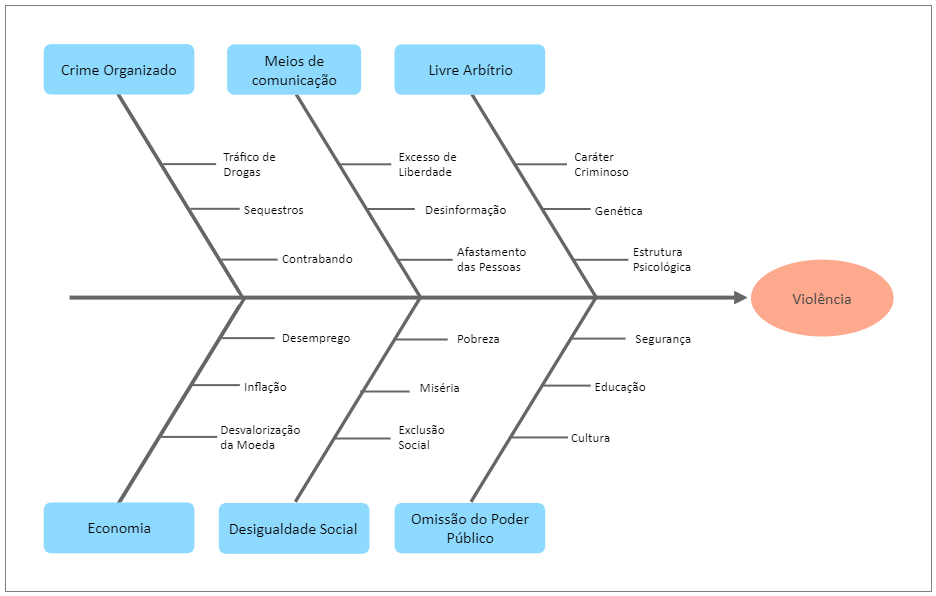
A cause and effect diagram investigates why something happened or could happen by categorizing probable causes. It can also be used to demonstrate the links between relevant components. It is one of the Seven Basic Tools of Quality and is also known as a fishbone diagram or an Ishikawa diagram. The goal of the Cause and Effect Diagram is to depict all of the causes that lead to a certain occurrence. The concerns in a Cause and Effect Diagram are frequently created from a brainstorming session, which is then followed by the creation of an Affinity Diagram.


 Desktop