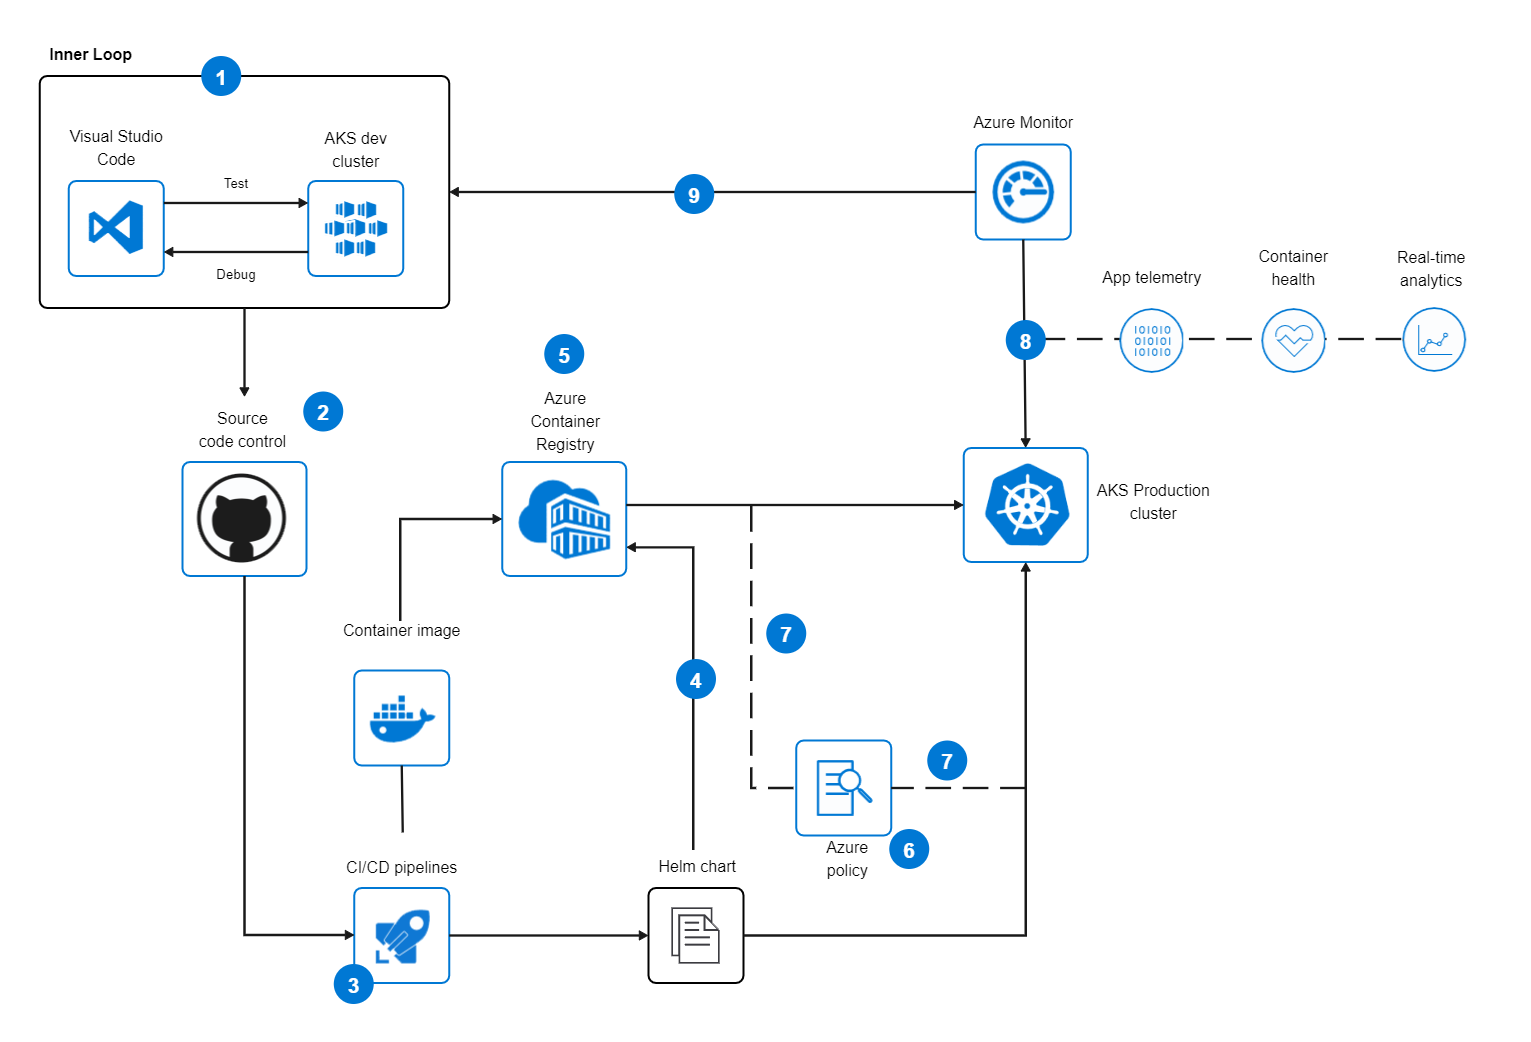
Many organizations use this Azure DevOps Diagram for process visualization instead of creating diagrams separately from their requirements documentation. Traditionally, charts and needs are kept separate. The horizontal axis in Azure DevOps Diagram displays a timeline, and the vertical axis shows the number of work items in your columns. To ensure a stable process, keep the number of work in progress within the WIP limits for each column. Azure DevOps offers developer services that enable teams to plan their work, collaborate on code development, and build and deploy applications. Azure DevOps fosters a collaborative culture and processes that bring together software developers, project managers, and contributors.


 Desktop