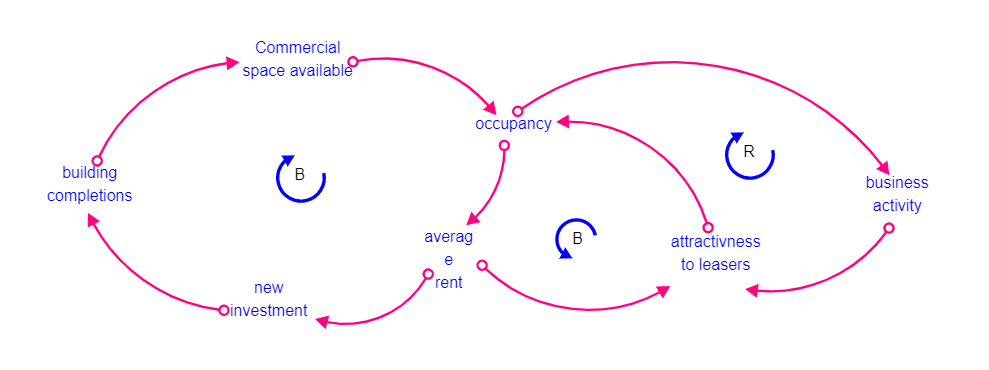
This CLD Diagram was created to explain or communicate your model or a simplified version (CLD). Only the dominant feedback loops or selected causal connections between variables in your model can be displayed using a CLD Diagram. The CLD diagram is a fundamental tool in system dynamics, a method of analysis used to create an understanding of complex systems. This diagram depicts the behavior of a system by showing a collection of connected nodes and the feedback loops formed by the connections. One or more of the nodes show the problem's symptoms. The remaining nodes are the causal chains that are causing the problem.


 Desktop